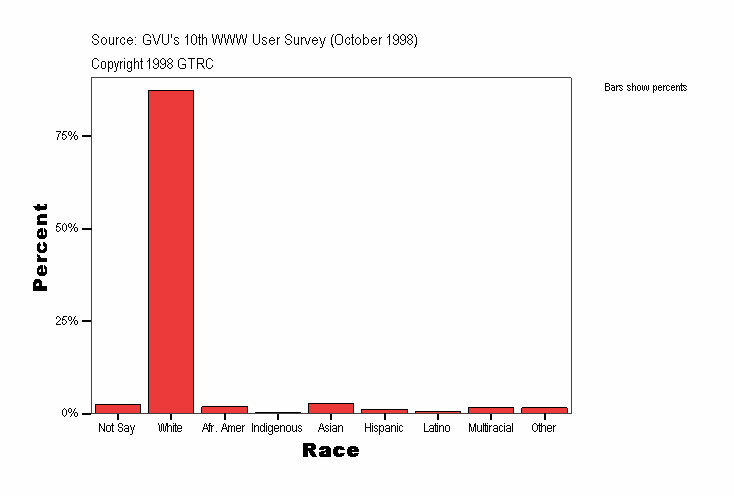
Race
|
Frequency |
Percent |
Valid Percent |
Cumulative Percent |
|---|
| Valid |
Not Say |
125
| 2.5
| 2.5
| 2.5
|
|---|
| White |
4380
| 87.2
| 87.2
| 89.7
|
|---|
| Afr. Amer |
97
| 1.9
| 1.9
| 91.7
|
|---|
| Indigenous |
16
| .3
| .3
| 92.0
|
|---|
| Asian |
145
| 2.9
| 2.9
| 94.9
|
|---|
| Hispanic |
63
| 1.3
| 1.3
| 96.1
|
|---|
| Latino |
32
| .6
| .6
| 96.8
|
|---|
| Multiracial |
82
| 1.6
| 1.6
| 98.4
|
|---|
| Other |
81
| 1.6
| 1.6
| 100.0
|
|---|
| Total |
5021
| 100.0
| 100.0
|
|
|---|
| Missing |
System |
1
| .0
|
|
|
|---|
| Total |
5022
| 100.0
|
|
|
|---|
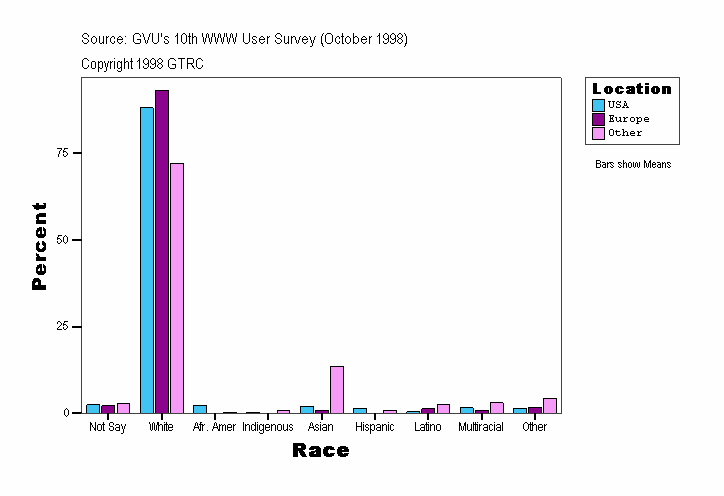
Race
| Location |
Frequency |
Percent |
Valid Percent |
Cumulative Percent |
|---|
| USA |
Valid |
Not Say |
106
| 2.5
| 2.5
| 2.5
|
|---|
| White |
3748
| 88.1
| 88.1
| 90.6
|
|---|
| Afr. Amer |
96
| 2.3
| 2.3
| 92.9
|
|---|
| Indigenous |
13
| .3
| .3
| 93.2
|
|---|
| Asian |
88
| 2.1
| 2.1
| 95.3
|
|---|
| Hispanic |
60
| 1.4
| 1.4
| 96.7
|
|---|
| Latino |
17
| .4
| .4
| 97.1
|
|---|
| Multiracial |
67
| 1.6
| 1.6
| 98.6
|
|---|
| Other |
58
| 1.4
| 1.4
| 100.0
|
|---|
| Total |
4253
| 100.0
| 100.0
|
|
|---|
| Missing |
System |
1
| .0
|
|
|
|---|
| Total |
4254
| 100.0
|
|
|
|---|
| Europe |
Valid |
Not Say |
8
| 2.2
| 2.2
| 2.2
|
|---|
| White |
344
| 93.2
| 93.2
| 95.4
|
|---|
| Asian |
3
| .8
| .8
| 96.2
|
|---|
| Latino |
5
| 1.4
| 1.4
| 97.6
|
|---|
| Multiracial |
3
| .8
| .8
| 98.4
|
|---|
| Other |
6
| 1.6
| 1.6
| 100.0
|
|---|
| Total |
369
| 100.0
| 100.0
|
|
|---|
| Other |
Valid |
Not Say |
11
| 2.8
| 2.8
| 2.8
|
|---|
| White |
288
| 72.2
| 72.2
| 74.9
|
|---|
| Afr. Amer |
1
| .3
| .3
| 75.2
|
|---|
| Indigenous |
3
| .8
| .8
| 75.9
|
|---|
| Asian |
54
| 13.5
| 13.5
| 89.5
|
|---|
| Hispanic |
3
| .8
| .8
| 90.2
|
|---|
| Latino |
10
| 2.5
| 2.5
| 92.7
|
|---|
| Multiracial |
12
| 3.0
| 3.0
| 95.7
|
|---|
| Other |
17
| 4.3
| 4.3
| 100.0
|
|---|
| Total |
399
| 100.0
| 100.0
|
|
|---|
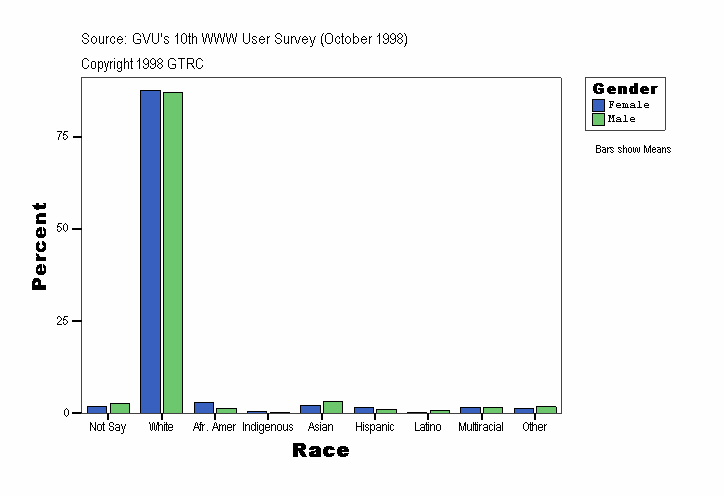
Race
| Gender |
Frequency |
Percent |
Valid Percent |
Cumulative Percent |
|---|
| Female |
Valid |
Not Say |
32
| 1.9
| 1.9
| 1.9
|
|---|
| White |
1475
| 87.5
| 87.5
| 89.4
|
|---|
| Afr. Amer |
51
| 3.0
| 3.0
| 92.5
|
|---|
| Indigenous |
9
| .5
| .5
| 93.0
|
|---|
| Asian |
37
| 2.2
| 2.2
| 95.2
|
|---|
| Hispanic |
27
| 1.6
| 1.6
| 96.8
|
|---|
| Latino |
5
| .3
| .3
| 97.1
|
|---|
| Multiracial |
28
| 1.7
| 1.7
| 98.8
|
|---|
| Other |
21
| 1.2
| 1.2
| 100.0
|
|---|
| Total |
1685
| 100.0
| 100.0
|
|
|---|
| Male |
Valid |
Not Say |
93
| 2.8
| 2.8
| 2.8
|
|---|
| White |
2905
| 87.1
| 87.1
| 89.9
|
|---|
| Afr. Amer |
46
| 1.4
| 1.4
| 91.2
|
|---|
| Indigenous |
7
| .2
| .2
| 91.5
|
|---|
| Asian |
108
| 3.2
| 3.2
| 94.7
|
|---|
| Hispanic |
36
| 1.1
| 1.1
| 95.8
|
|---|
| Latino |
27
| .8
| .8
| 96.6
|
|---|
| Multiracial |
54
| 1.6
| 1.6
| 98.2
|
|---|
| Other |
60
| 1.8
| 1.8
| 100.0
|
|---|
| Total |
3336
| 100.0
| 100.0
|
|
|---|
| Missing |
System |
1
| .0
|
|
|
|---|
| Total |
3337
| 100.0
|
|
|
|---|
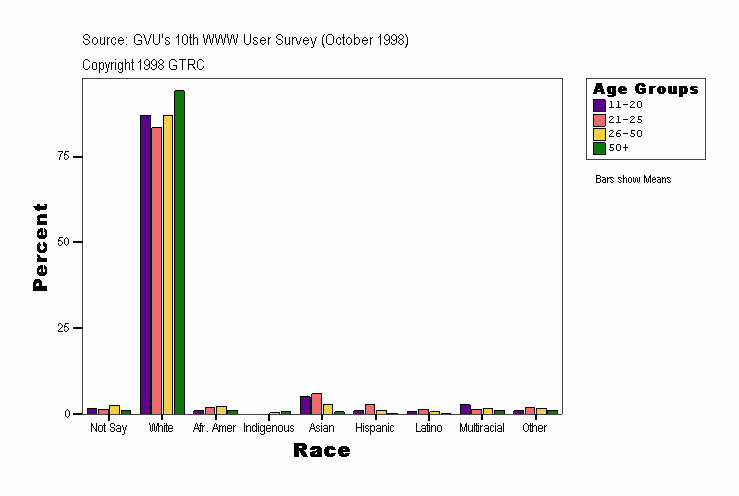
Race
| Age Groups |
Frequency |
Percent |
Valid Percent |
Cumulative Percent |
|---|
| . |
Valid |
Not Say |
25
| 29.8
| 30.1
| 30.1
|
|---|
| White |
46
| 54.8
| 55.4
| 85.5
|
|---|
| Afr. Amer |
1
| 1.2
| 1.2
| 86.7
|
|---|
| Asian |
2
| 2.4
| 2.4
| 89.2
|
|---|
| Hispanic |
3
| 3.6
| 3.6
| 92.8
|
|---|
| Latino |
1
| 1.2
| 1.2
| 94.0
|
|---|
| Multiracial |
1
| 1.2
| 1.2
| 95.2
|
|---|
| Other |
4
| 4.8
| 4.8
| 100.0
|
|---|
| Total |
83
| 98.8
| 100.0
|
|
|---|
| Missing |
System |
1
| 1.2
|
|
|
|---|
| Total |
84
| 100.0
|
|
|
|---|
| 11-20 |
Valid |
Not Say |
5
| 1.7
| 1.7
| 1.7
|
|---|
| White |
261
| 87.0
| 87.0
| 88.7
|
|---|
| Afr. Amer |
3
| 1.0
| 1.0
| 89.7
|
|---|
| Asian |
15
| 5.0
| 5.0
| 94.7
|
|---|
| Hispanic |
3
| 1.0
| 1.0
| 95.7
|
|---|
| Latino |
2
| .7
| .7
| 96.3
|
|---|
| Multiracial |
8
| 2.7
| 2.7
| 99.0
|
|---|
| Other |
3
| 1.0
| 1.0
| 100.0
|
|---|
| Total |
300
| 100.0
| 100.0
|
|
|---|
| 21-25 |
Valid |
Not Say |
9
| 1.4
| 1.4
| 1.4
|
|---|
| White |
523
| 83.4
| 83.4
| 84.8
|
|---|
| Afr. Amer |
11
| 1.8
| 1.8
| 86.6
|
|---|
| Asian |
37
| 5.9
| 5.9
| 92.5
|
|---|
| Hispanic |
18
| 2.9
| 2.9
| 95.4
|
|---|
| Latino |
8
| 1.3
| 1.3
| 96.7
|
|---|
| Multiracial |
9
| 1.4
| 1.4
| 98.1
|
|---|
| Other |
12
| 1.9
| 1.9
| 100.0
|
|---|
| Total |
627
| 100.0
| 100.0
|
|
|---|
| 26-50 |
Valid |
Not Say |
78
| 2.5
| 2.5
| 2.5
|
|---|
| White |
2759
| 87.0
| 87.0
| 89.5
|
|---|
| Afr. Amer |
73
| 2.3
| 2.3
| 91.8
|
|---|
| Indigenous |
11
| .3
| .3
| 92.1
|
|---|
| Asian |
86
| 2.7
| 2.7
| 94.8
|
|---|
| Hispanic |
37
| 1.2
| 1.2
| 96.0
|
|---|
| Latino |
19
| .6
| .6
| 96.6
|
|---|
| Multiracial |
55
| 1.7
| 1.7
| 98.3
|
|---|
| Other |
53
| 1.7
| 1.7
| 100.0
|
|---|
| Total |
3171
| 100.0
| 100.0
|
|
|---|
| 50+ |
Valid |
Not Say |
8
| 1.0
| 1.0
| 1.0
|
|---|
| White |
791
| 94.2
| 94.2
| 95.1
|
|---|
| Afr. Amer |
9
| 1.1
| 1.1
| 96.2
|
|---|
| Indigenous |
5
| .6
| .6
| 96.8
|
|---|
| Asian |
5
| .6
| .6
| 97.4
|
|---|
| Hispanic |
2
| .2
| .2
| 97.6
|
|---|
| Latino |
2
| .2
| .2
| 97.9
|
|---|
| Multiracial |
9
| 1.1
| 1.1
| 98.9
|
|---|
| Other |
9
| 1.1
| 1.1
| 100.0
|
|---|
| Total |
840
| 100.0
| 100.0
|
|
|---|
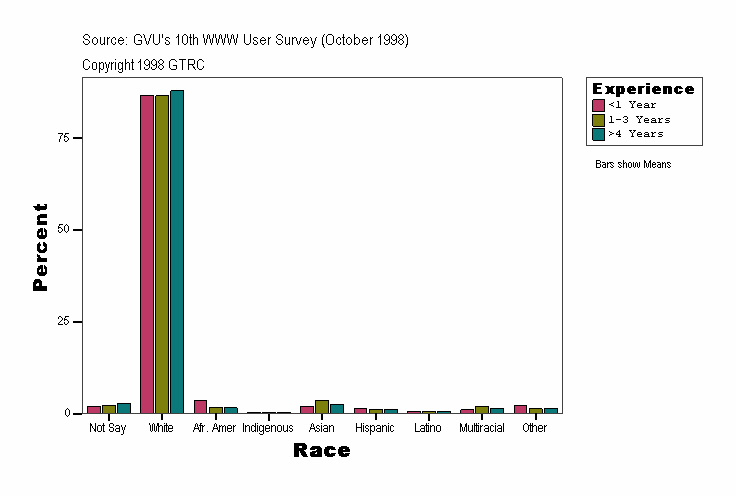
Race
| Experience |
Frequency |
Percent |
Valid Percent |
Cumulative Percent |
|---|
| <1 Year |
Valid |
Not Say |
13
| 2.0
| 2.0
| 2.0
|
|---|
| White |
565
| 86.5
| 86.5
| 88.5
|
|---|
| Afr. Amer |
23
| 3.5
| 3.5
| 92.0
|
|---|
| Indigenous |
3
| .5
| .5
| 92.5
|
|---|
| Asian |
13
| 2.0
| 2.0
| 94.5
|
|---|
| Hispanic |
9
| 1.4
| 1.4
| 95.9
|
|---|
| Latino |
5
| .8
| .8
| 96.6
|
|---|
| Multiracial |
7
| 1.1
| 1.1
| 97.7
|
|---|
| Other |
15
| 2.3
| 2.3
| 100.0
|
|---|
| Total |
653
| 100.0
| 100.0
|
|
|---|
| 1-3 Years |
Valid |
Not Say |
38
| 2.2
| 2.2
| 2.2
|
|---|
| White |
1502
| 86.5
| 86.6
| 88.8
|
|---|
| Afr. Amer |
31
| 1.8
| 1.8
| 90.5
|
|---|
| Indigenous |
5
| .3
| .3
| 90.8
|
|---|
| Asian |
65
| 3.7
| 3.7
| 94.6
|
|---|
| Hispanic |
22
| 1.3
| 1.3
| 95.9
|
|---|
| Latino |
11
| .6
| .6
| 96.5
|
|---|
| Multiracial |
36
| 2.1
| 2.1
| 98.6
|
|---|
| Other |
25
| 1.4
| 1.4
| 100.0
|
|---|
| Total |
1735
| 99.9
| 100.0
|
|
|---|
| Missing |
System |
1
| .1
|
|
|
|---|
| Total |
1736
| 100.0
|
|
|
|---|
| >4 Years |
Valid |
Not Say |
74
| 2.8
| 2.8
| 2.8
|
|---|
| White |
2313
| 87.8
| 87.8
| 90.7
|
|---|
| Afr. Amer |
43
| 1.6
| 1.6
| 92.3
|
|---|
| Indigenous |
8
| .3
| .3
| 92.6
|
|---|
| Asian |
67
| 2.5
| 2.5
| 95.1
|
|---|
| Hispanic |
32
| 1.2
| 1.2
| 96.4
|
|---|
| Latino |
16
| .6
| .6
| 97.0
|
|---|
| Multiracial |
39
| 1.5
| 1.5
| 98.4
|
|---|
| Other |
41
| 1.6
| 1.6
| 100.0
|
|---|
| Total |
2633
| 100.0
| 100.0
|
|
|---|
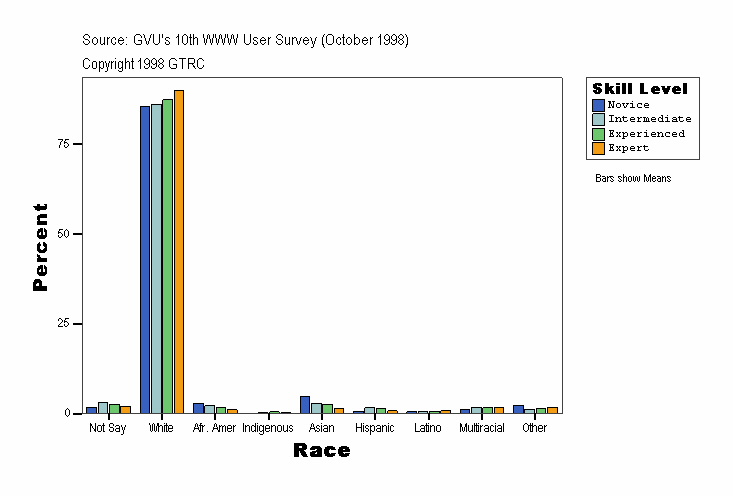
Race
| Skill Level |
Frequency |
Percent |
Valid Percent |
Cumulative Percent |
|---|
| Novice |
Valid |
Not Say |
15
| 1.9
| 1.9
| 1.9
|
|---|
| White |
692
| 85.6
| 85.6
| 87.5
|
|---|
| Afr. Amer |
23
| 2.8
| 2.8
| 90.3
|
|---|
| Indigenous |
1
| .1
| .1
| 90.5
|
|---|
| Asian |
39
| 4.8
| 4.8
| 95.3
|
|---|
| Hispanic |
6
| .7
| .7
| 96.0
|
|---|
| Latino |
4
| .5
| .5
| 96.5
|
|---|
| Multiracial |
9
| 1.1
| 1.1
| 97.6
|
|---|
| Other |
19
| 2.4
| 2.4
| 100.0
|
|---|
| Total |
808
| 100.0
| 100.0
|
|
|---|
| Intermediate |
Valid |
Not Say |
43
| 3.0
| 3.0
| 3.0
|
|---|
| White |
1237
| 86.2
| 86.3
| 89.3
|
|---|
| Afr. Amer |
31
| 2.2
| 2.2
| 91.4
|
|---|
| Indigenous |
4
| .3
| .3
| 91.7
|
|---|
| Asian |
42
| 2.9
| 2.9
| 94.6
|
|---|
| Hispanic |
24
| 1.7
| 1.7
| 96.3
|
|---|
| Latino |
10
| .7
| .7
| 97.0
|
|---|
| Multiracial |
26
| 1.8
| 1.8
| 98.8
|
|---|
| Other |
17
| 1.2
| 1.2
| 100.0
|
|---|
| Total |
1434
| 99.9
| 100.0
|
|
|---|
| Missing |
System |
1
| .1
|
|
|
|---|
| Total |
1435
| 100.0
|
|
|
|---|
| Experienced |
Valid |
Not Say |
48
| 2.6
| 2.6
| 2.6
|
|---|
| White |
1620
| 87.3
| 87.3
| 89.9
|
|---|
| Afr. Amer |
33
| 1.8
| 1.8
| 91.7
|
|---|
| Indigenous |
9
| .5
| .5
| 92.2
|
|---|
| Asian |
50
| 2.7
| 2.7
| 94.9
|
|---|
| Hispanic |
26
| 1.4
| 1.4
| 96.3
|
|---|
| Latino |
11
| .6
| .6
| 96.9
|
|---|
| Multiracial |
30
| 1.6
| 1.6
| 98.5
|
|---|
| Other |
28
| 1.5
| 1.5
| 100.0
|
|---|
| Total |
1855
| 100.0
| 100.0
|
|
|---|
| Expert |
Valid |
Not Say |
19
| 2.1
| 2.1
| 2.1
|
|---|
| White |
831
| 89.9
| 89.9
| 92.0
|
|---|
| Afr. Amer |
10
| 1.1
| 1.1
| 93.1
|
|---|
| Indigenous |
2
| .2
| .2
| 93.3
|
|---|
| Asian |
14
| 1.5
| 1.5
| 94.8
|
|---|
| Hispanic |
7
| .8
| .8
| 95.6
|
|---|
| Latino |
7
| .8
| .8
| 96.3
|
|---|
| Multiracial |
17
| 1.8
| 1.8
| 98.2
|
|---|
| Other |
17
| 1.8
| 1.8
| 100.0
|
|---|
| Total |
924
| 100.0
| 100.0
|
|
|---|
Source: GVU's Tenth WWW User Survey (Conducted October 1998)
URL:http://www.gvu.gatech.edu/user_surveys/
Copyright 1998 GTRC - ALL RIGHTS RESERVED
Contact: www-survey@cc.gatech.edu
For more information or to submit comments:
send email to www-survey@cc.gatech.edu.
GVU's WWW Surveying Team
Graphics, Visualization, & Usability Center
College of Computing
Georgia Institute of Technology
Atlanta, GA 30332-0280
