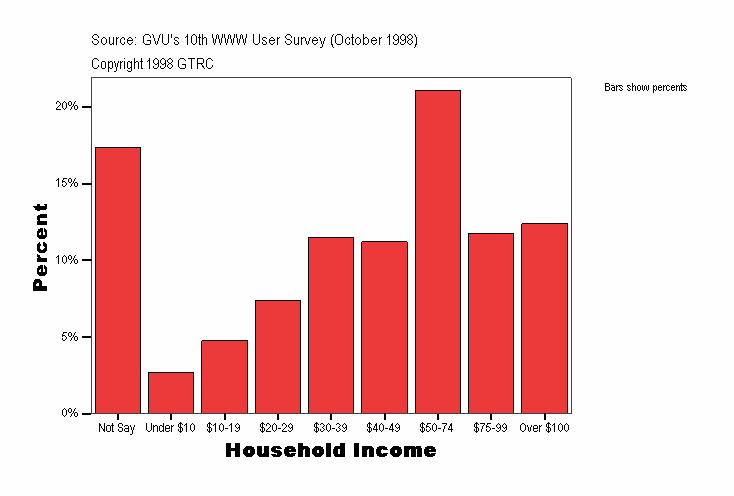
Household Income
|
Frequency |
Percent |
Valid Percent |
Cumulative Percent |
|---|
| Valid |
Not Say |
870
| 17.3
| 17.3
| 17.3
|
|---|
| Under $10 |
134
| 2.7
| 2.7
| 20.0
|
|---|
| $10-19 |
239
| 4.8
| 4.8
| 24.8
|
|---|
| $20-29 |
369
| 7.3
| 7.3
| 32.1
|
|---|
| $30-39 |
578
| 11.5
| 11.5
| 43.6
|
|---|
| $40-49 |
562
| 11.2
| 11.2
| 54.8
|
|---|
| $50-74 |
1057
| 21.0
| 21.0
| 75.8
|
|---|
| $75-99 |
591
| 11.8
| 11.8
| 87.6
|
|---|
| Over $100 |
622
| 12.4
| 12.4
| 100.0
|
|---|
| Total |
5022
| 100.0
| 100.0
|
|
|---|
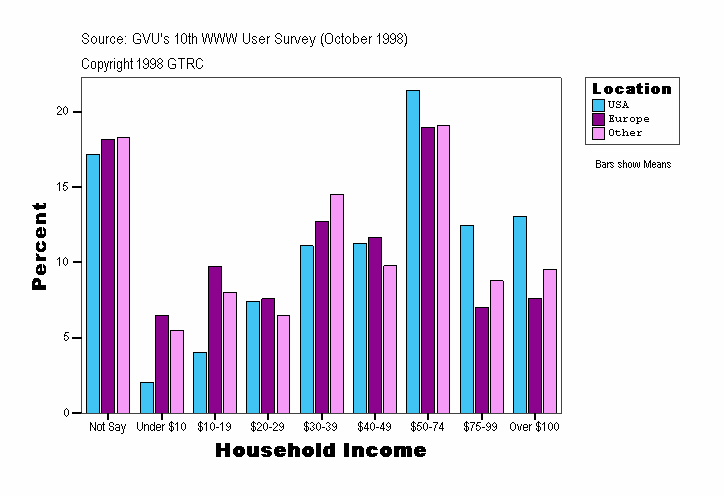
Household Income
| Location |
Frequency |
Percent |
Valid Percent |
Cumulative Percent |
|---|
| USA |
Valid |
Not Say |
730
| 17.2
| 17.2
| 17.2
|
|---|
| Under $10 |
88
| 2.1
| 2.1
| 19.2
|
|---|
| $10-19 |
171
| 4.0
| 4.0
| 23.2
|
|---|
| $20-29 |
315
| 7.4
| 7.4
| 30.7
|
|---|
| $30-39 |
473
| 11.1
| 11.1
| 41.8
|
|---|
| $40-49 |
480
| 11.3
| 11.3
| 53.1
|
|---|
| $50-74 |
911
| 21.4
| 21.4
| 74.5
|
|---|
| $75-99 |
530
| 12.5
| 12.5
| 86.9
|
|---|
| Over $100 |
556
| 13.1
| 13.1
| 100.0
|
|---|
| Total |
4254
| 100.0
| 100.0
|
|
|---|
| Europe |
Valid |
Not Say |
67
| 18.2
| 18.2
| 18.2
|
|---|
| Under $10 |
24
| 6.5
| 6.5
| 24.7
|
|---|
| $10-19 |
36
| 9.8
| 9.8
| 34.4
|
|---|
| $20-29 |
28
| 7.6
| 7.6
| 42.0
|
|---|
| $30-39 |
47
| 12.7
| 12.7
| 54.7
|
|---|
| $40-49 |
43
| 11.7
| 11.7
| 66.4
|
|---|
| $50-74 |
70
| 19.0
| 19.0
| 85.4
|
|---|
| $75-99 |
26
| 7.0
| 7.0
| 92.4
|
|---|
| Over $100 |
28
| 7.6
| 7.6
| 100.0
|
|---|
| Total |
369
| 100.0
| 100.0
|
|
|---|
| Other |
Valid |
Not Say |
73
| 18.3
| 18.3
| 18.3
|
|---|
| Under $10 |
22
| 5.5
| 5.5
| 23.8
|
|---|
| $10-19 |
32
| 8.0
| 8.0
| 31.8
|
|---|
| $20-29 |
26
| 6.5
| 6.5
| 38.3
|
|---|
| $30-39 |
58
| 14.5
| 14.5
| 52.9
|
|---|
| $40-49 |
39
| 9.8
| 9.8
| 62.7
|
|---|
| $50-74 |
76
| 19.0
| 19.0
| 81.7
|
|---|
| $75-99 |
35
| 8.8
| 8.8
| 90.5
|
|---|
| Over $100 |
38
| 9.5
| 9.5
| 100.0
|
|---|
| Total |
399
| 100.0
| 100.0
|
|
|---|
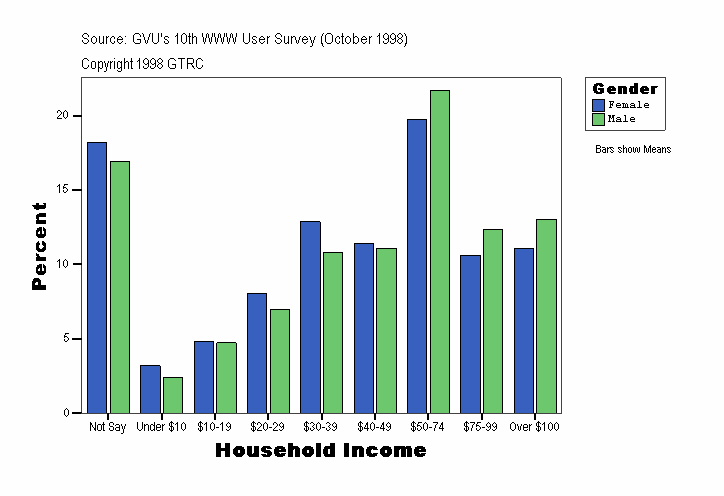
Household Income
| Gender |
Frequency |
Percent |
Valid Percent |
Cumulative Percent |
|---|
| Female |
Valid |
Not Say |
306
| 18.2
| 18.2
| 18.2
|
|---|
| Under $10 |
54
| 3.2
| 3.2
| 21.4
|
|---|
| $10-19 |
81
| 4.8
| 4.8
| 26.2
|
|---|
| $20-29 |
136
| 8.1
| 8.1
| 34.2
|
|---|
| $30-39 |
217
| 12.9
| 12.9
| 47.1
|
|---|
| $40-49 |
192
| 11.4
| 11.4
| 58.5
|
|---|
| $50-74 |
333
| 19.8
| 19.8
| 78.3
|
|---|
| $75-99 |
179
| 10.6
| 10.6
| 88.9
|
|---|
| Over $100 |
187
| 11.1
| 11.1
| 100.0
|
|---|
| Total |
1685
| 100.0
| 100.0
|
|
|---|
| Male |
Valid |
Not Say |
564
| 16.9
| 16.9
| 16.9
|
|---|
| Under $10 |
80
| 2.4
| 2.4
| 19.3
|
|---|
| $10-19 |
158
| 4.7
| 4.7
| 24.0
|
|---|
| $20-29 |
233
| 7.0
| 7.0
| 31.0
|
|---|
| $30-39 |
361
| 10.8
| 10.8
| 41.8
|
|---|
| $40-49 |
370
| 11.1
| 11.1
| 52.9
|
|---|
| $50-74 |
724
| 21.7
| 21.7
| 74.6
|
|---|
| $75-99 |
412
| 12.3
| 12.3
| 87.0
|
|---|
| Over $100 |
435
| 13.0
| 13.0
| 100.0
|
|---|
| Total |
3337
| 100.0
| 100.0
|
|
|---|
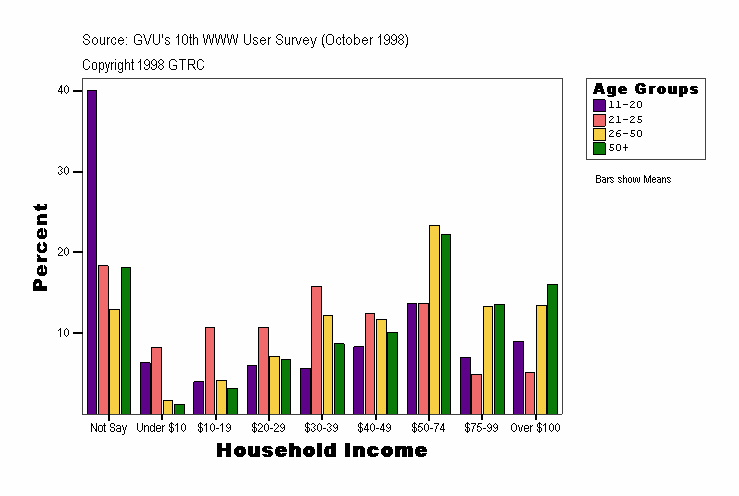
Household Income
| Age Groups |
Frequency |
Percent |
Valid Percent |
Cumulative Percent |
|---|
| . |
Valid |
Not Say |
71
| 84.5
| 84.5
| 84.5
|
|---|
| Under $10 |
1
| 1.2
| 1.2
| 85.7
|
|---|
| $10-19 |
1
| 1.2
| 1.2
| 86.9
|
|---|
| $20-29 |
1
| 1.2
| 1.2
| 88.1
|
|---|
| $30-39 |
1
| 1.2
| 1.2
| 89.3
|
|---|
| $40-49 |
1
| 1.2
| 1.2
| 90.5
|
|---|
| $50-74 |
3
| 3.6
| 3.6
| 94.0
|
|---|
| $75-99 |
3
| 3.6
| 3.6
| 97.6
|
|---|
| Over $100 |
2
| 2.4
| 2.4
| 100.0
|
|---|
| Total |
84
| 100.0
| 100.0
|
|
|---|
| 11-20 |
Valid |
Not Say |
120
| 40.0
| 40.0
| 40.0
|
|---|
| Under $10 |
19
| 6.3
| 6.3
| 46.3
|
|---|
| $10-19 |
12
| 4.0
| 4.0
| 50.3
|
|---|
| $20-29 |
18
| 6.0
| 6.0
| 56.3
|
|---|
| $30-39 |
17
| 5.7
| 5.7
| 62.0
|
|---|
| $40-49 |
25
| 8.3
| 8.3
| 70.3
|
|---|
| $50-74 |
41
| 13.7
| 13.7
| 84.0
|
|---|
| $75-99 |
21
| 7.0
| 7.0
| 91.0
|
|---|
| Over $100 |
27
| 9.0
| 9.0
| 100.0
|
|---|
| Total |
300
| 100.0
| 100.0
|
|
|---|
| 21-25 |
Valid |
Not Say |
115
| 18.3
| 18.3
| 18.3
|
|---|
| Under $10 |
52
| 8.3
| 8.3
| 26.6
|
|---|
| $10-19 |
67
| 10.7
| 10.7
| 37.3
|
|---|
| $20-29 |
67
| 10.7
| 10.7
| 48.0
|
|---|
| $30-39 |
99
| 15.8
| 15.8
| 63.8
|
|---|
| $40-49 |
78
| 12.4
| 12.4
| 76.2
|
|---|
| $50-74 |
86
| 13.7
| 13.7
| 90.0
|
|---|
| $75-99 |
31
| 4.9
| 4.9
| 94.9
|
|---|
| Over $100 |
32
| 5.1
| 5.1
| 100.0
|
|---|
| Total |
627
| 100.0
| 100.0
|
|
|---|
| 26-50 |
Valid |
Not Say |
412
| 13.0
| 13.0
| 13.0
|
|---|
| Under $10 |
52
| 1.6
| 1.6
| 14.6
|
|---|
| $10-19 |
132
| 4.2
| 4.2
| 18.8
|
|---|
| $20-29 |
226
| 7.1
| 7.1
| 25.9
|
|---|
| $30-39 |
388
| 12.2
| 12.2
| 38.2
|
|---|
| $40-49 |
373
| 11.8
| 11.8
| 49.9
|
|---|
| $50-74 |
740
| 23.3
| 23.3
| 73.3
|
|---|
| $75-99 |
422
| 13.3
| 13.3
| 86.6
|
|---|
| Over $100 |
426
| 13.4
| 13.4
| 100.0
|
|---|
| Total |
3171
| 100.0
| 100.0
|
|
|---|
| 50+ |
Valid |
Not Say |
152
| 18.1
| 18.1
| 18.1
|
|---|
| Under $10 |
10
| 1.2
| 1.2
| 19.3
|
|---|
| $10-19 |
27
| 3.2
| 3.2
| 22.5
|
|---|
| $20-29 |
57
| 6.8
| 6.8
| 29.3
|
|---|
| $30-39 |
73
| 8.7
| 8.7
| 38.0
|
|---|
| $40-49 |
85
| 10.1
| 10.1
| 48.1
|
|---|
| $50-74 |
187
| 22.3
| 22.3
| 70.4
|
|---|
| $75-99 |
114
| 13.6
| 13.6
| 83.9
|
|---|
| Over $100 |
135
| 16.1
| 16.1
| 100.0
|
|---|
| Total |
840
| 100.0
| 100.0
|
|
|---|
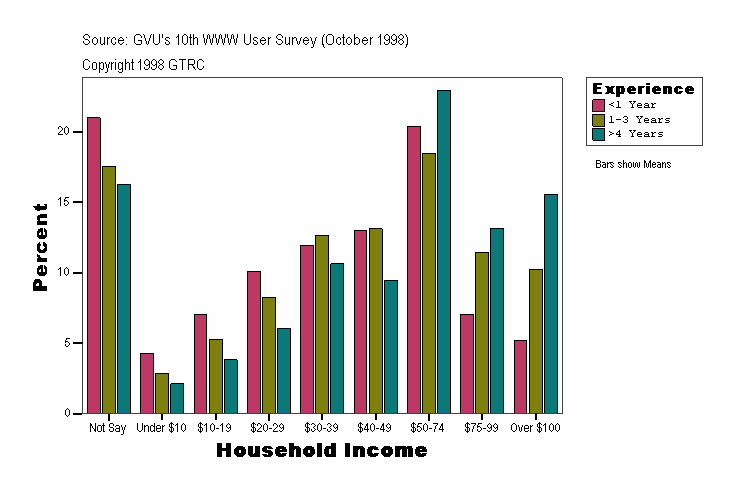
Household Income
| Experience |
Frequency |
Percent |
Valid Percent |
Cumulative Percent |
|---|
| <1 Year |
Valid |
Not Say |
137
| 21.0
| 21.0
| 21.0
|
|---|
| Under $10 |
28
| 4.3
| 4.3
| 25.3
|
|---|
| $10-19 |
46
| 7.0
| 7.0
| 32.3
|
|---|
| $20-29 |
66
| 10.1
| 10.1
| 42.4
|
|---|
| $30-39 |
78
| 11.9
| 11.9
| 54.4
|
|---|
| $40-49 |
85
| 13.0
| 13.0
| 67.4
|
|---|
| $50-74 |
133
| 20.4
| 20.4
| 87.7
|
|---|
| $75-99 |
46
| 7.0
| 7.0
| 94.8
|
|---|
| Over $100 |
34
| 5.2
| 5.2
| 100.0
|
|---|
| Total |
653
| 100.0
| 100.0
|
|
|---|
| 1-3 Years |
Valid |
Not Say |
305
| 17.6
| 17.6
| 17.6
|
|---|
| Under $10 |
50
| 2.9
| 2.9
| 20.4
|
|---|
| $10-19 |
92
| 5.3
| 5.3
| 25.7
|
|---|
| $20-29 |
143
| 8.2
| 8.2
| 34.0
|
|---|
| $30-39 |
220
| 12.7
| 12.7
| 46.7
|
|---|
| $40-49 |
228
| 13.1
| 13.1
| 59.8
|
|---|
| $50-74 |
321
| 18.5
| 18.5
| 78.3
|
|---|
| $75-99 |
199
| 11.5
| 11.5
| 89.7
|
|---|
| Over $100 |
178
| 10.3
| 10.3
| 100.0
|
|---|
| Total |
1736
| 100.0
| 100.0
|
|
|---|
| >4 Years |
Valid |
Not Say |
428
| 16.3
| 16.3
| 16.3
|
|---|
| Under $10 |
56
| 2.1
| 2.1
| 18.4
|
|---|
| $10-19 |
101
| 3.8
| 3.8
| 22.2
|
|---|
| $20-29 |
160
| 6.1
| 6.1
| 28.3
|
|---|
| $30-39 |
280
| 10.6
| 10.6
| 38.9
|
|---|
| $40-49 |
249
| 9.5
| 9.5
| 48.4
|
|---|
| $50-74 |
603
| 22.9
| 22.9
| 71.3
|
|---|
| $75-99 |
346
| 13.1
| 13.1
| 84.4
|
|---|
| Over $100 |
410
| 15.6
| 15.6
| 100.0
|
|---|
| Total |
2633
| 100.0
| 100.0
|
|
|---|
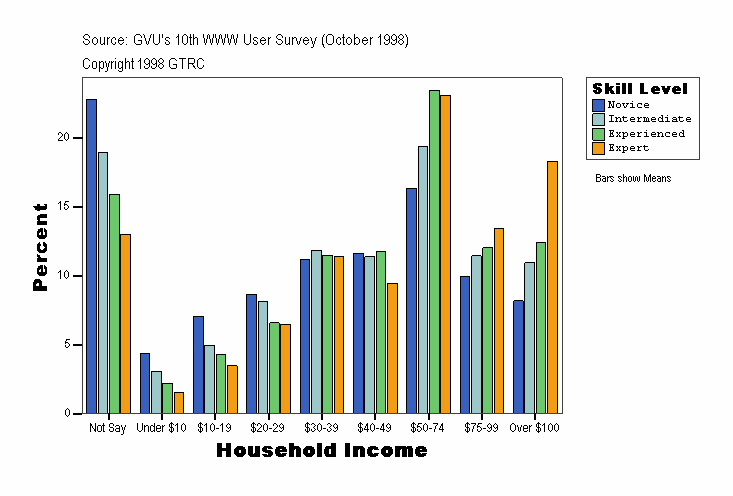
Household Income
| Skill Level |
Frequency |
Percent |
Valid Percent |
Cumulative Percent |
|---|
| Novice |
Valid |
Not Say |
184
| 22.8
| 22.8
| 22.8
|
|---|
| Under $10 |
35
| 4.3
| 4.3
| 27.1
|
|---|
| $10-19 |
57
| 7.1
| 7.1
| 34.2
|
|---|
| $20-29 |
70
| 8.7
| 8.7
| 42.8
|
|---|
| $30-39 |
90
| 11.1
| 11.1
| 54.0
|
|---|
| $40-49 |
94
| 11.6
| 11.6
| 65.6
|
|---|
| $50-74 |
132
| 16.3
| 16.3
| 81.9
|
|---|
| $75-99 |
80
| 9.9
| 9.9
| 91.8
|
|---|
| Over $100 |
66
| 8.2
| 8.2
| 100.0
|
|---|
| Total |
808
| 100.0
| 100.0
|
|
|---|
| Intermediate |
Valid |
Not Say |
271
| 18.9
| 18.9
| 18.9
|
|---|
| Under $10 |
44
| 3.1
| 3.1
| 22.0
|
|---|
| $10-19 |
71
| 4.9
| 4.9
| 26.9
|
|---|
| $20-29 |
117
| 8.2
| 8.2
| 35.1
|
|---|
| $30-39 |
170
| 11.8
| 11.8
| 46.9
|
|---|
| $40-49 |
163
| 11.4
| 11.4
| 58.3
|
|---|
| $50-74 |
278
| 19.4
| 19.4
| 77.6
|
|---|
| $75-99 |
164
| 11.4
| 11.4
| 89.1
|
|---|
| Over $100 |
157
| 10.9
| 10.9
| 100.0
|
|---|
| Total |
1435
| 100.0
| 100.0
|
|
|---|
| Experienced |
Valid |
Not Say |
295
| 15.9
| 15.9
| 15.9
|
|---|
| Under $10 |
41
| 2.2
| 2.2
| 18.1
|
|---|
| $10-19 |
79
| 4.3
| 4.3
| 22.4
|
|---|
| $20-29 |
122
| 6.6
| 6.6
| 28.9
|
|---|
| $30-39 |
213
| 11.5
| 11.5
| 40.4
|
|---|
| $40-49 |
218
| 11.8
| 11.8
| 52.2
|
|---|
| $50-74 |
434
| 23.4
| 23.4
| 75.6
|
|---|
| $75-99 |
223
| 12.0
| 12.0
| 87.6
|
|---|
| Over $100 |
230
| 12.4
| 12.4
| 100.0
|
|---|
| Total |
1855
| 100.0
| 100.0
|
|
|---|
| Expert |
Valid |
Not Say |
120
| 13.0
| 13.0
| 13.0
|
|---|
| Under $10 |
14
| 1.5
| 1.5
| 14.5
|
|---|
| $10-19 |
32
| 3.5
| 3.5
| 18.0
|
|---|
| $20-29 |
60
| 6.5
| 6.5
| 24.5
|
|---|
| $30-39 |
105
| 11.4
| 11.4
| 35.8
|
|---|
| $40-49 |
87
| 9.4
| 9.4
| 45.2
|
|---|
| $50-74 |
213
| 23.1
| 23.1
| 68.3
|
|---|
| $75-99 |
124
| 13.4
| 13.4
| 81.7
|
|---|
| Over $100 |
169
| 18.3
| 18.3
| 100.0
|
|---|
| Total |
924
| 100.0
| 100.0
|
|
|---|
Source: GVU's Tenth WWW User Survey (Conducted October 1998)
URL:http://www.gvu.gatech.edu/user_surveys/
Copyright 1998 GTRC - ALL RIGHTS RESERVED
Contact: www-survey@cc.gatech.edu
For more information or to submit comments:
send email to www-survey@cc.gatech.edu.
GVU's WWW Surveying Team
Graphics, Visualization, & Usability Center
College of Computing
Georgia Institute of Technology
Atlanta, GA 30332-0280
