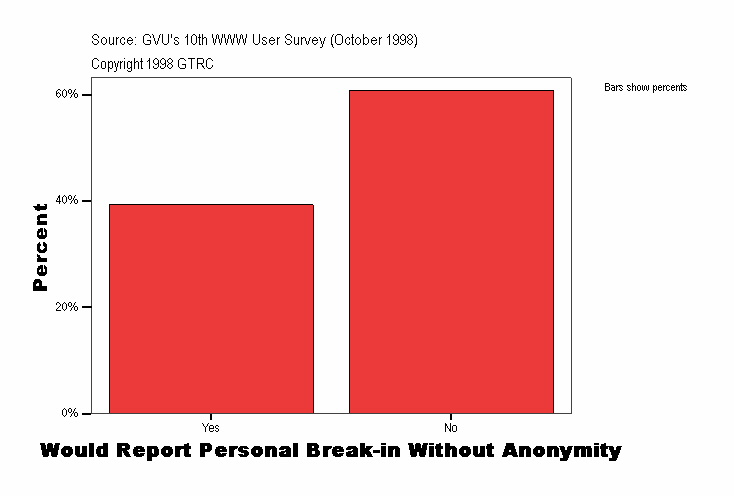
Would Report Personal Break-in Without Anonymity
|
Frequency |
Percent |
Valid Percent |
Cumulative Percent |
|---|
| Valid |
Yes |
582
| 39.3
| 39.3
| 39.3
|
|---|
| No |
900
| 60.7
| 60.7
| 100.0
|
|---|
| Total |
1482
| 100.0
| 100.0
|
|
|---|
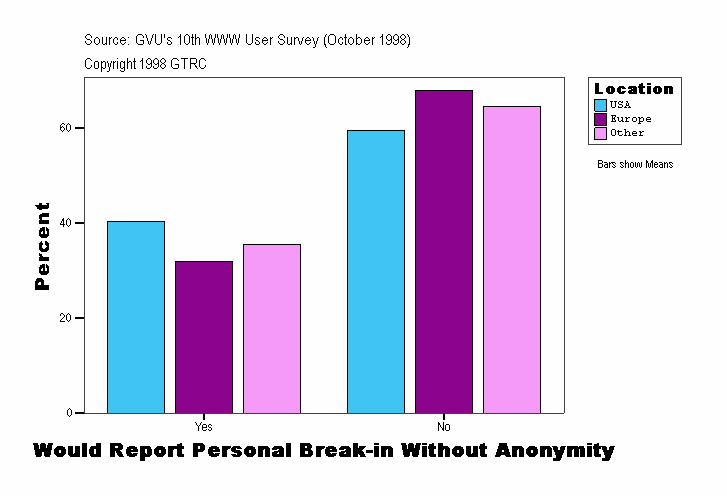
Would Report Personal Break-in Without Anonymity
| Location |
Frequency |
Percent |
Valid Percent |
Cumulative Percent |
|---|
| . |
Valid |
Yes |
9
| 37.5
| 37.5
| 37.5
|
|---|
| No |
15
| 62.5
| 62.5
| 100.0
|
|---|
| Total |
24
| 100.0
| 100.0
|
|
|---|
| USA |
Valid |
Yes |
494
| 40.4
| 40.4
| 40.4
|
|---|
| No |
729
| 59.6
| 59.6
| 100.0
|
|---|
| Total |
1223
| 100.0
| 100.0
|
|
|---|
| Europe |
Valid |
Yes |
41
| 32.0
| 32.0
| 32.0
|
|---|
| No |
87
| 68.0
| 68.0
| 100.0
|
|---|
| Total |
128
| 100.0
| 100.0
|
|
|---|
| Other |
Valid |
Yes |
38
| 35.5
| 35.5
| 35.5
|
|---|
| No |
69
| 64.5
| 64.5
| 100.0
|
|---|
| Total |
107
| 100.0
| 100.0
|
|
|---|
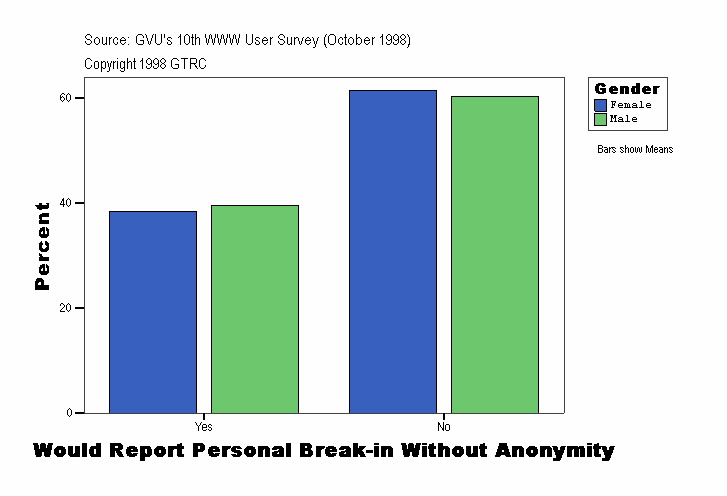
Would Report Personal Break-in Without Anonymity
| Gender |
Frequency |
Percent |
Valid Percent |
Cumulative Percent |
|---|
| . |
Valid |
Yes |
9
| 37.5
| 37.5
| 37.5
|
|---|
| No |
15
| 62.5
| 62.5
| 100.0
|
|---|
| Total |
24
| 100.0
| 100.0
|
|
|---|
| Female |
Valid |
Yes |
176
| 38.5
| 38.5
| 38.5
|
|---|
| No |
281
| 61.5
| 61.5
| 100.0
|
|---|
| Total |
457
| 100.0
| 100.0
|
|
|---|
| Male |
Valid |
Yes |
397
| 39.7
| 39.7
| 39.7
|
|---|
| No |
604
| 60.3
| 60.3
| 100.0
|
|---|
| Total |
1001
| 100.0
| 100.0
|
|
|---|
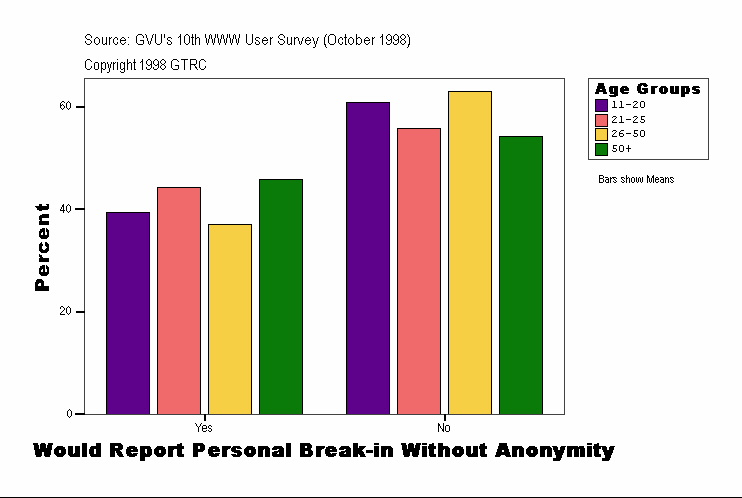
Would Report Personal Break-in Without Anonymity
| Age Groups |
Frequency |
Percent |
Valid Percent |
Cumulative Percent |
|---|
| . |
Valid |
Yes |
14
| 26.9
| 26.9
| 26.9
|
|---|
| No |
38
| 73.1
| 73.1
| 100.0
|
|---|
| Total |
52
| 100.0
| 100.0
|
|
|---|
| 11-20 |
Valid |
Yes |
31
| 39.2
| 39.2
| 39.2
|
|---|
| No |
48
| 60.8
| 60.8
| 100.0
|
|---|
| Total |
79
| 100.0
| 100.0
|
|
|---|
| 21-25 |
Valid |
Yes |
81
| 44.3
| 44.3
| 44.3
|
|---|
| No |
102
| 55.7
| 55.7
| 100.0
|
|---|
| Total |
183
| 100.0
| 100.0
|
|
|---|
| 26-50 |
Valid |
Yes |
331
| 37.0
| 37.0
| 37.0
|
|---|
| No |
564
| 63.0
| 63.0
| 100.0
|
|---|
| Total |
895
| 100.0
| 100.0
|
|
|---|
| 50+ |
Valid |
Yes |
125
| 45.8
| 45.8
| 45.8
|
|---|
| No |
148
| 54.2
| 54.2
| 100.0
|
|---|
| Total |
273
| 100.0
| 100.0
|
|
|---|
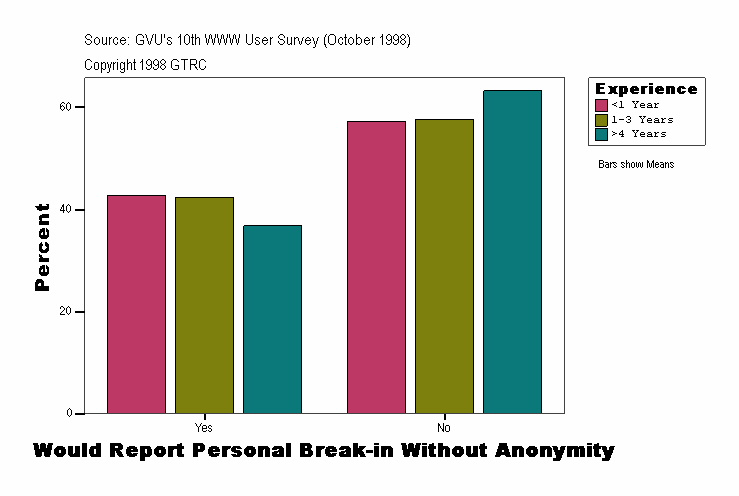
Would Report Personal Break-in Without Anonymity
| Experience |
Frequency |
Percent |
Valid Percent |
Cumulative Percent |
|---|
| . |
Valid |
Yes |
9
| 37.5
| 37.5
| 37.5
|
|---|
| No |
15
| 62.5
| 62.5
| 100.0
|
|---|
| Total |
24
| 100.0
| 100.0
|
|
|---|
| <1 Year |
Valid |
Yes |
83
| 42.8
| 42.8
| 42.8
|
|---|
| No |
111
| 57.2
| 57.2
| 100.0
|
|---|
| Total |
194
| 100.0
| 100.0
|
|
|---|
| 1-3 Years |
Valid |
Yes |
189
| 42.4
| 42.4
| 42.4
|
|---|
| No |
257
| 57.6
| 57.6
| 100.0
|
|---|
| Total |
446
| 100.0
| 100.0
|
|
|---|
| >4 Years |
Valid |
Yes |
301
| 36.8
| 36.8
| 36.8
|
|---|
| No |
517
| 63.2
| 63.2
| 100.0
|
|---|
| Total |
818
| 100.0
| 100.0
|
|
|---|
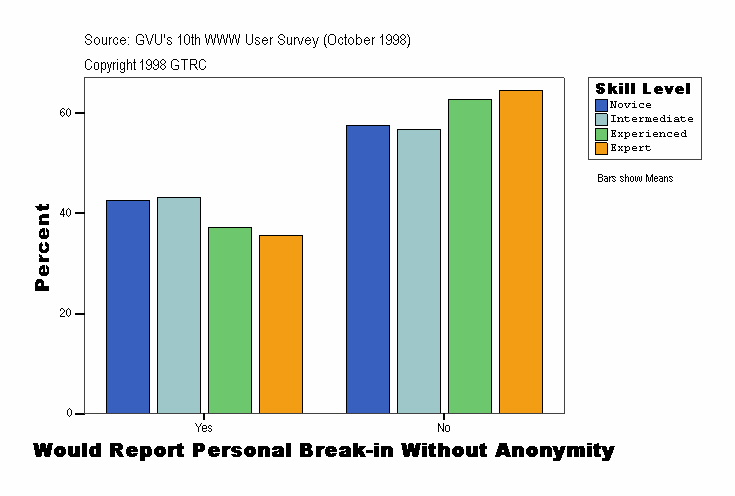
Would Report Personal Break-in Without Anonymity
| Skill Level |
Frequency |
Percent |
Valid Percent |
Cumulative Percent |
|---|
| . |
Valid |
Yes |
9
| 37.5
| 37.5
| 37.5
|
|---|
| No |
15
| 62.5
| 62.5
| 100.0
|
|---|
| Total |
24
| 100.0
| 100.0
|
|
|---|
| Novice |
Valid |
Yes |
85
| 42.5
| 42.5
| 42.5
|
|---|
| No |
115
| 57.5
| 57.5
| 100.0
|
|---|
| Total |
200
| 100.0
| 100.0
|
|
|---|
| Intermediate |
Valid |
Yes |
178
| 43.2
| 43.2
| 43.2
|
|---|
| No |
234
| 56.8
| 56.8
| 100.0
|
|---|
| Total |
412
| 100.0
| 100.0
|
|
|---|
| Experienced |
Valid |
Yes |
207
| 37.2
| 37.2
| 37.2
|
|---|
| No |
349
| 62.8
| 62.8
| 100.0
|
|---|
| Total |
556
| 100.0
| 100.0
|
|
|---|
| Expert |
Valid |
Yes |
103
| 35.5
| 35.5
| 35.5
|
|---|
| No |
187
| 64.5
| 64.5
| 100.0
|
|---|
| Total |
290
| 100.0
| 100.0
|
|
|---|
Source: GVU's Tenth WWW User Survey (Conducted October 1998)
URL:http://www.gvu.gatech.edu/user_surveys/
Copyright 1998 GTRC - ALL RIGHTS RESERVED
Contact: www-survey@cc.gatech.edu
For more information or to submit comments:
send email to www-survey@cc.gatech.edu.
GVU's WWW Surveying Team
Graphics, Visualization, & Usability Center
College of Computing
Georgia Institute of Technology
Atlanta, GA 30332-0280
