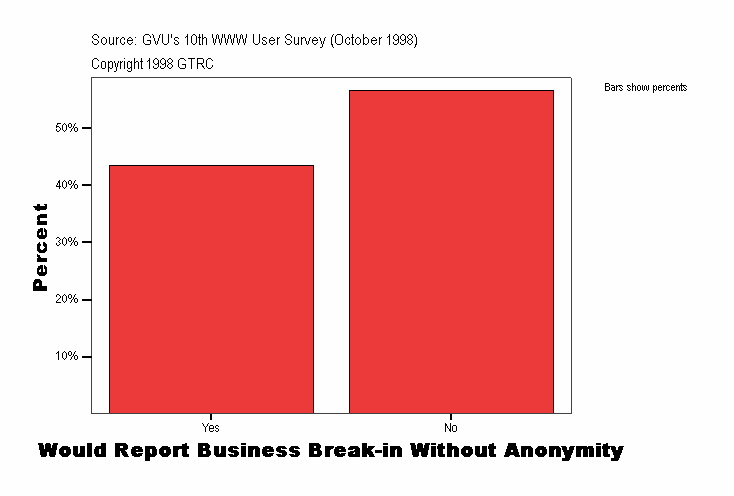
Would Report Business Break-in Without Anonymity
|
Frequency |
Percent |
Valid Percent |
Cumulative Percent |
|---|
| Valid |
Yes |
644
| 43.5
| 43.5
| 43.5
|
|---|
| No |
838
| 56.5
| 56.5
| 100.0
|
|---|
| Total |
1482
| 100.0
| 100.0
|
|
|---|
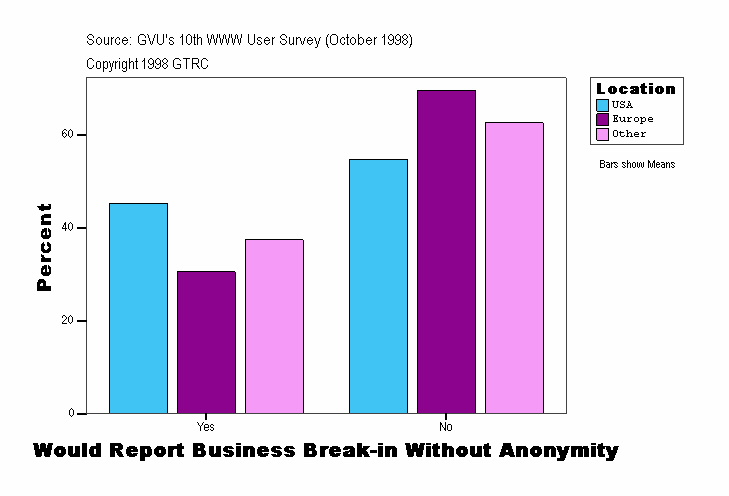
Would Report Business Break-in Without Anonymity
| Location |
Frequency |
Percent |
Valid Percent |
Cumulative Percent |
|---|
| . |
Valid |
Yes |
11
| 45.8
| 45.8
| 45.8
|
|---|
| No |
13
| 54.2
| 54.2
| 100.0
|
|---|
| Total |
24
| 100.0
| 100.0
|
|
|---|
| USA |
Valid |
Yes |
554
| 45.3
| 45.3
| 45.3
|
|---|
| No |
669
| 54.7
| 54.7
| 100.0
|
|---|
| Total |
1223
| 100.0
| 100.0
|
|
|---|
| Europe |
Valid |
Yes |
39
| 30.5
| 30.5
| 30.5
|
|---|
| No |
89
| 69.5
| 69.5
| 100.0
|
|---|
| Total |
128
| 100.0
| 100.0
|
|
|---|
| Other |
Valid |
Yes |
40
| 37.4
| 37.4
| 37.4
|
|---|
| No |
67
| 62.6
| 62.6
| 100.0
|
|---|
| Total |
107
| 100.0
| 100.0
|
|
|---|
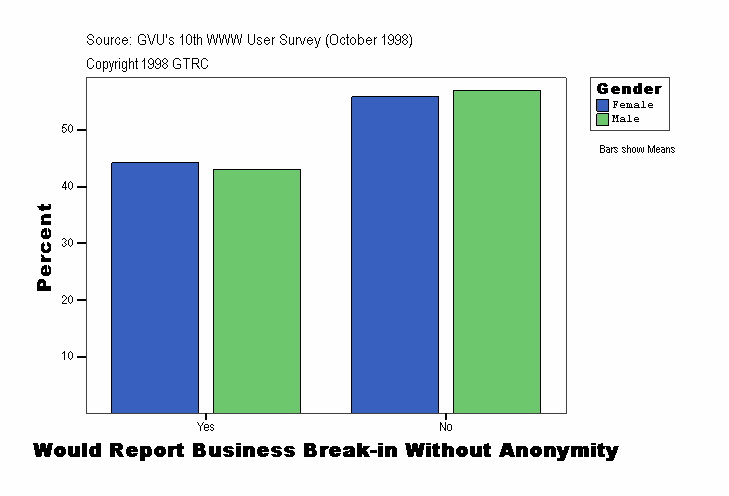
Would Report Business Break-in Without Anonymity
| Gender |
Frequency |
Percent |
Valid Percent |
Cumulative Percent |
|---|
| . |
Valid |
Yes |
11
| 45.8
| 45.8
| 45.8
|
|---|
| No |
13
| 54.2
| 54.2
| 100.0
|
|---|
| Total |
24
| 100.0
| 100.0
|
|
|---|
| Female |
Valid |
Yes |
202
| 44.2
| 44.2
| 44.2
|
|---|
| No |
255
| 55.8
| 55.8
| 100.0
|
|---|
| Total |
457
| 100.0
| 100.0
|
|
|---|
| Male |
Valid |
Yes |
431
| 43.1
| 43.1
| 43.1
|
|---|
| No |
570
| 56.9
| 56.9
| 100.0
|
|---|
| Total |
1001
| 100.0
| 100.0
|
|
|---|
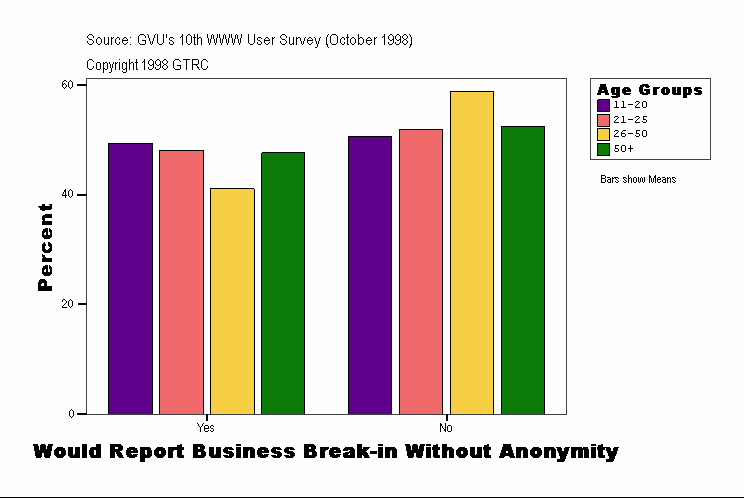
Would Report Business Break-in Without Anonymity
| Age Groups |
Frequency |
Percent |
Valid Percent |
Cumulative Percent |
|---|
| . |
Valid |
Yes |
19
| 36.5
| 36.5
| 36.5
|
|---|
| No |
33
| 63.5
| 63.5
| 100.0
|
|---|
| Total |
52
| 100.0
| 100.0
|
|
|---|
| 11-20 |
Valid |
Yes |
39
| 49.4
| 49.4
| 49.4
|
|---|
| No |
40
| 50.6
| 50.6
| 100.0
|
|---|
| Total |
79
| 100.0
| 100.0
|
|
|---|
| 21-25 |
Valid |
Yes |
88
| 48.1
| 48.1
| 48.1
|
|---|
| No |
95
| 51.9
| 51.9
| 100.0
|
|---|
| Total |
183
| 100.0
| 100.0
|
|
|---|
| 26-50 |
Valid |
Yes |
368
| 41.1
| 41.1
| 41.1
|
|---|
| No |
527
| 58.9
| 58.9
| 100.0
|
|---|
| Total |
895
| 100.0
| 100.0
|
|
|---|
| 50+ |
Valid |
Yes |
130
| 47.6
| 47.6
| 47.6
|
|---|
| No |
143
| 52.4
| 52.4
| 100.0
|
|---|
| Total |
273
| 100.0
| 100.0
|
|
|---|
Would Report Business Break-in Without Anonymity
| Experience |
Frequency |
Percent |
Valid Percent |
Cumulative Percent |
|---|
| . |
Valid |
Yes |
11
| 45.8
| 45.8
| 45.8
|
|---|
| No |
13
| 54.2
| 54.2
| 100.0
|
|---|
| Total |
24
| 100.0
| 100.0
|
|
|---|
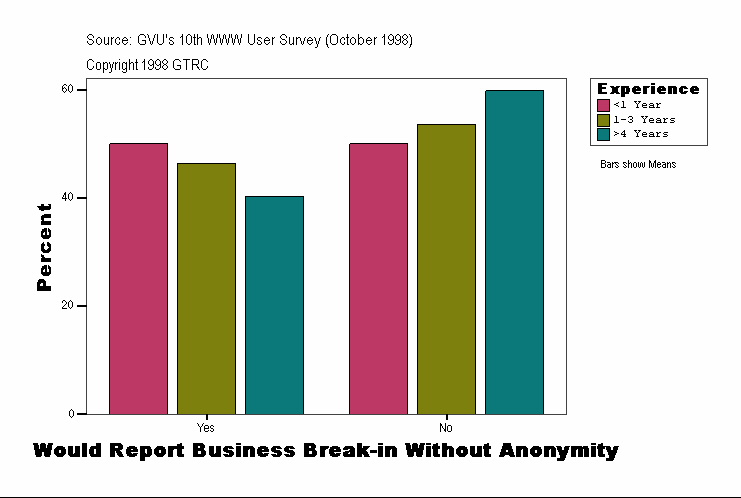
| <1 Year |
Valid |
Yes |
97
| 50.0
| 50.0
| 50.0
|
|---|
| No |
97
| 50.0
| 50.0
| 100.0
|
|---|
| Total |
194
| 100.0
| 100.0
|
|
|---|
| 1-3 Years |
Valid |
Yes |
207
| 46.4
| 46.4
| 46.4
|
|---|
| No |
239
| 53.6
| 53.6
| 100.0
|
|---|
| Total |
446
| 100.0
| 100.0
|
|
|---|
| >4 Years |
Valid |
Yes |
329
| 40.2
| 40.2
| 40.2
|
|---|
| No |
489
| 59.8
| 59.8
| 100.0
|
|---|
| Total |
818
| 100.0
| 100.0
|
|
|---|
Would Report Business Break-in Without Anonymity
| Skill Level |
Frequency |
Percent |
Valid Percent |
Cumulative Percent |
|---|
| . |
Valid |
Yes |
11
| 45.8
| 45.8
| 45.8
|
|---|
| No |
13
| 54.2
| 54.2
| 100.0
|
|---|
| Total |
24
| 100.0
| 100.0
|
|
|---|
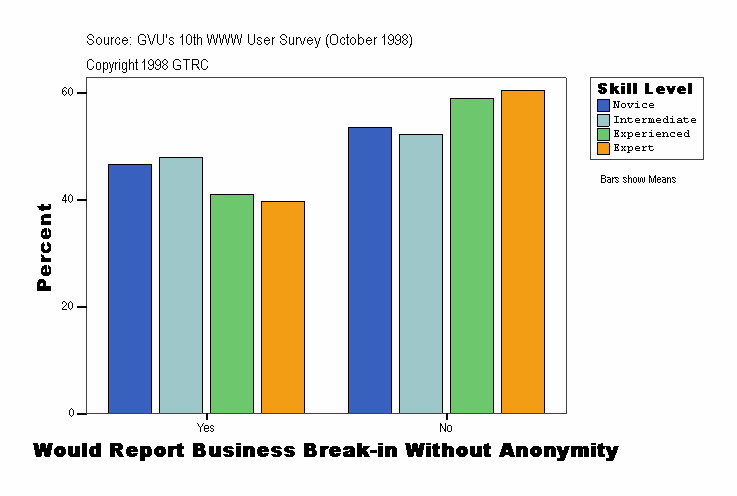
| Novice |
Valid |
Yes |
93
| 46.5
| 46.5
| 46.5
|
|---|
| No |
107
| 53.5
| 53.5
| 100.0
|
|---|
| Total |
200
| 100.0
| 100.0
|
|
|---|
| Intermediate |
Valid |
Yes |
197
| 47.8
| 47.8
| 47.8
|
|---|
| No |
215
| 52.2
| 52.2
| 100.0
|
|---|
| Total |
412
| 100.0
| 100.0
|
|
|---|
| Experienced |
Valid |
Yes |
228
| 41.0
| 41.0
| 41.0
|
|---|
| No |
328
| 59.0
| 59.0
| 100.0
|
|---|
| Total |
556
| 100.0
| 100.0
|
|
|---|
| Expert |
Valid |
Yes |
115
| 39.7
| 39.7
| 39.7
|
|---|
| No |
175
| 60.3
| 60.3
| 100.0
|
|---|
| Total |
290
| 100.0
| 100.0
|
|
|---|
Source: GVU's Tenth WWW User Survey (Conducted October 1998)
URL:http://www.gvu.gatech.edu/user_surveys/
Copyright 1998 GTRC - ALL RIGHTS RESERVED
Contact: www-survey@cc.gatech.edu
For more information or to submit comments:
send email to www-survey@cc.gatech.edu.
GVU's WWW Surveying Team
Graphics, Visualization, & Usability Center
College of Computing
Georgia Institute of Technology
Atlanta, GA 30332-0280
