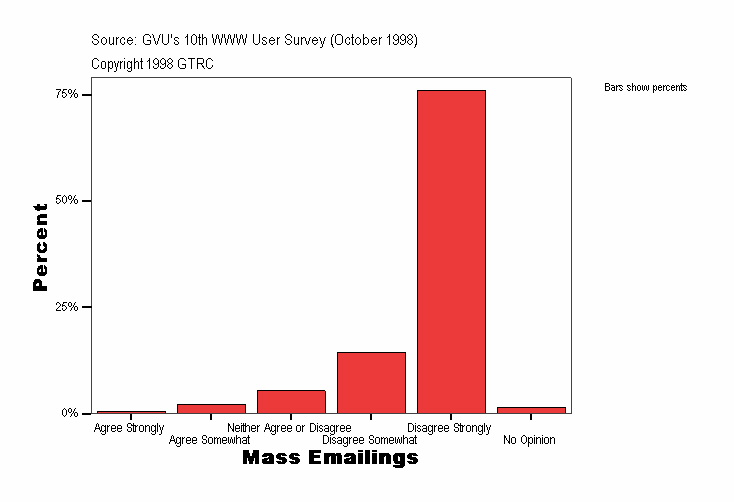
Mass Emailings
|
Frequency |
Percent |
Valid Percent |
Cumulative Percent |
|---|
| Valid |
Agree Strongly |
8
| .5
| .5
| .5
|
|---|
| Agree Somewhat |
34
| 2.3
| 2.3
| 2.8
|
|---|
| Neither Agree or Disagree |
80
| 5.4
| 5.4
| 8.2
|
|---|
| Disagree Somewhat |
214
| 14.4
| 14.4
| 22.7
|
|---|
| Disagree Strongly |
1125
| 75.9
| 75.9
| 98.6
|
|---|
| No Opinion |
21
| 1.4
| 1.4
| 100.0
|
|---|
| Total |
1482
| 100.0
| 100.0
|
|
|---|
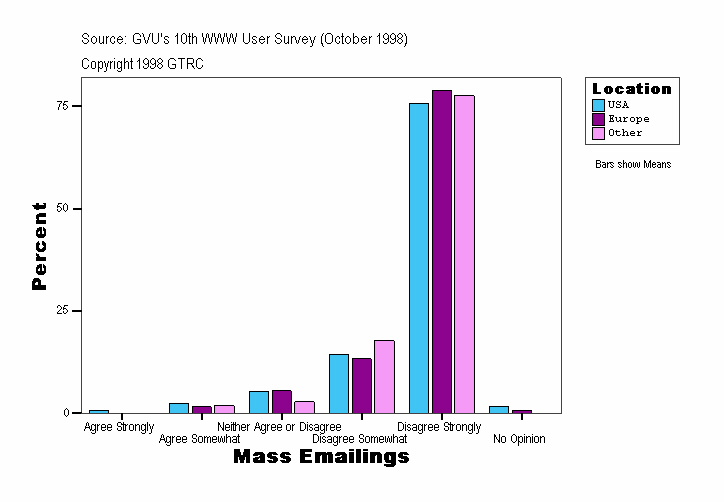
Mass Emailings
| Location |
Frequency |
Percent |
Valid Percent |
Cumulative Percent |
|---|
| . |
Valid |
Agree Strongly |
1
| 4.2
| 4.2
| 4.2
|
|---|
| Agree Somewhat |
2
| 8.3
| 8.3
| 12.5
|
|---|
| Neither Agree or Disagree |
4
| 16.7
| 16.7
| 29.2
|
|---|
| Disagree Somewhat |
2
| 8.3
| 8.3
| 37.5
|
|---|
| Disagree Strongly |
15
| 62.5
| 62.5
| 100.0
|
|---|
| Total |
24
| 100.0
| 100.0
|
|
|---|
| USA |
Valid |
Agree Strongly |
7
| .6
| .6
| .6
|
|---|
| Agree Somewhat |
28
| 2.3
| 2.3
| 2.9
|
|---|
| Neither Agree or Disagree |
66
| 5.4
| 5.4
| 8.3
|
|---|
| Disagree Somewhat |
176
| 14.4
| 14.4
| 22.6
|
|---|
| Disagree Strongly |
926
| 75.7
| 75.7
| 98.4
|
|---|
| No Opinion |
20
| 1.6
| 1.6
| 100.0
|
|---|
| Total |
1223
| 100.0
| 100.0
|
|
|---|
| Europe |
Valid |
Agree Somewhat |
2
| 1.6
| 1.6
| 1.6
|
|---|
| Neither Agree or Disagree |
7
| 5.5
| 5.5
| 7.0
|
|---|
| Disagree Somewhat |
17
| 13.3
| 13.3
| 20.3
|
|---|
| Disagree Strongly |
101
| 78.9
| 78.9
| 99.2
|
|---|
| No Opinion |
1
| .8
| .8
| 100.0
|
|---|
| Total |
128
| 100.0
| 100.0
|
|
|---|
| Other |
Valid |
Agree Somewhat |
2
| 1.9
| 1.9
| 1.9
|
|---|
| Neither Agree or Disagree |
3
| 2.8
| 2.8
| 4.7
|
|---|
| Disagree Somewhat |
19
| 17.8
| 17.8
| 22.4
|
|---|
| Disagree Strongly |
83
| 77.6
| 77.6
| 100.0
|
|---|
| Total |
107
| 100.0
| 100.0
|
|
|---|
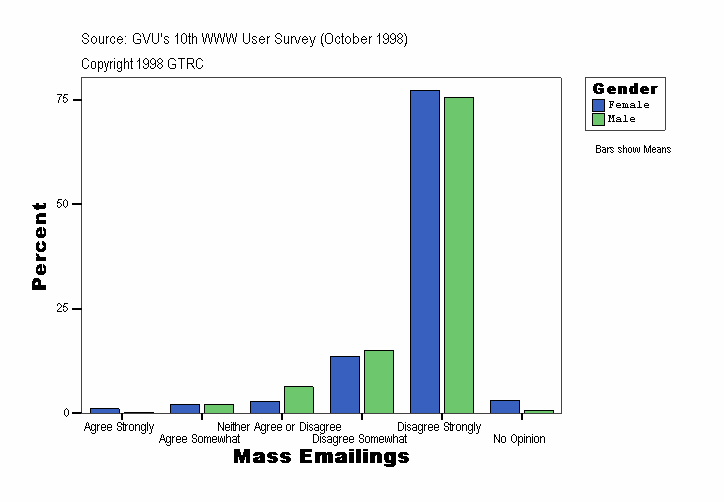
Mass Emailings
| Gender |
Frequency |
Percent |
Valid Percent |
Cumulative Percent |
|---|
| . |
Valid |
Agree Strongly |
1
| 4.2
| 4.2
| 4.2
|
|---|
| Agree Somewhat |
2
| 8.3
| 8.3
| 12.5
|
|---|
| Neither Agree or Disagree |
4
| 16.7
| 16.7
| 29.2
|
|---|
| Disagree Somewhat |
2
| 8.3
| 8.3
| 37.5
|
|---|
| Disagree Strongly |
15
| 62.5
| 62.5
| 100.0
|
|---|
| Total |
24
| 100.0
| 100.0
|
|
|---|
| Female |
Valid |
Agree Strongly |
5
| 1.1
| 1.1
| 1.1
|
|---|
| Agree Somewhat |
10
| 2.2
| 2.2
| 3.3
|
|---|
| Neither Agree or Disagree |
13
| 2.8
| 2.8
| 6.1
|
|---|
| Disagree Somewhat |
62
| 13.6
| 13.6
| 19.7
|
|---|
| Disagree Strongly |
353
| 77.2
| 77.2
| 96.9
|
|---|
| No Opinion |
14
| 3.1
| 3.1
| 100.0
|
|---|
| Total |
457
| 100.0
| 100.0
|
|
|---|
| Male |
Valid |
Agree Strongly |
2
| .2
| .2
| .2
|
|---|
| Agree Somewhat |
22
| 2.2
| 2.2
| 2.4
|
|---|
| Neither Agree or Disagree |
63
| 6.3
| 6.3
| 8.7
|
|---|
| Disagree Somewhat |
150
| 15.0
| 15.0
| 23.7
|
|---|
| Disagree Strongly |
757
| 75.6
| 75.6
| 99.3
|
|---|
| No Opinion |
7
| .7
| .7
| 100.0
|
|---|
| Total |
1001
| 100.0
| 100.0
|
|
|---|
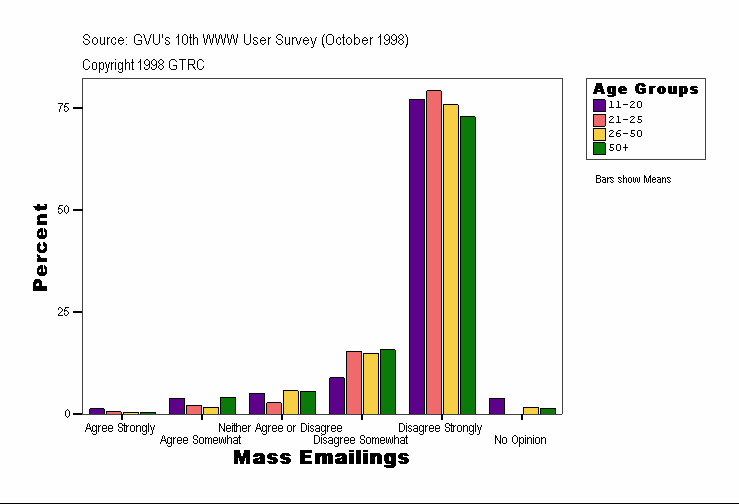
Mass Emailings
| Age Groups |
Frequency |
Percent |
Valid Percent |
Cumulative Percent |
|---|
| . |
Valid |
Agree Strongly |
1
| 1.9
| 1.9
| 1.9
|
|---|
| Agree Somewhat |
2
| 3.8
| 3.8
| 5.8
|
|---|
| Neither Agree or Disagree |
5
| 9.6
| 9.6
| 15.4
|
|---|
| Disagree Somewhat |
3
| 5.8
| 5.8
| 21.2
|
|---|
| Disagree Strongly |
41
| 78.8
| 78.8
| 100.0
|
|---|
| Total |
52
| 100.0
| 100.0
|
|
|---|
| 11-20 |
Valid |
Agree Strongly |
1
| 1.3
| 1.3
| 1.3
|
|---|
| Agree Somewhat |
3
| 3.8
| 3.8
| 5.1
|
|---|
| Neither Agree or Disagree |
4
| 5.1
| 5.1
| 10.1
|
|---|
| Disagree Somewhat |
7
| 8.9
| 8.9
| 19.0
|
|---|
| Disagree Strongly |
61
| 77.2
| 77.2
| 96.2
|
|---|
| No Opinion |
3
| 3.8
| 3.8
| 100.0
|
|---|
| Total |
79
| 100.0
| 100.0
|
|
|---|
| 21-25 |
Valid |
Agree Strongly |
1
| .5
| .5
| .5
|
|---|
| Agree Somewhat |
4
| 2.2
| 2.2
| 2.7
|
|---|
| Neither Agree or Disagree |
5
| 2.7
| 2.7
| 5.5
|
|---|
| Disagree Somewhat |
28
| 15.3
| 15.3
| 20.8
|
|---|
| Disagree Strongly |
145
| 79.2
| 79.2
| 100.0
|
|---|
| Total |
183
| 100.0
| 100.0
|
|
|---|
| 26-50 |
Valid |
Agree Strongly |
4
| .4
| .4
| .4
|
|---|
| Agree Somewhat |
14
| 1.6
| 1.6
| 2.0
|
|---|
| Neither Agree or Disagree |
51
| 5.7
| 5.7
| 7.7
|
|---|
| Disagree Somewhat |
133
| 14.9
| 14.9
| 22.6
|
|---|
| Disagree Strongly |
679
| 75.9
| 75.9
| 98.4
|
|---|
| No Opinion |
14
| 1.6
| 1.6
| 100.0
|
|---|
| Total |
895
| 100.0
| 100.0
|
|
|---|
| 50+ |
Valid |
Agree Strongly |
1
| .4
| .4
| .4
|
|---|
| Agree Somewhat |
11
| 4.0
| 4.0
| 4.4
|
|---|
| Neither Agree or Disagree |
15
| 5.5
| 5.5
| 9.9
|
|---|
| Disagree Somewhat |
43
| 15.8
| 15.8
| 25.6
|
|---|
| Disagree Strongly |
199
| 72.9
| 72.9
| 98.5
|
|---|
| No Opinion |
4
| 1.5
| 1.5
| 100.0
|
|---|
| Total |
273
| 100.0
| 100.0
|
|
|---|
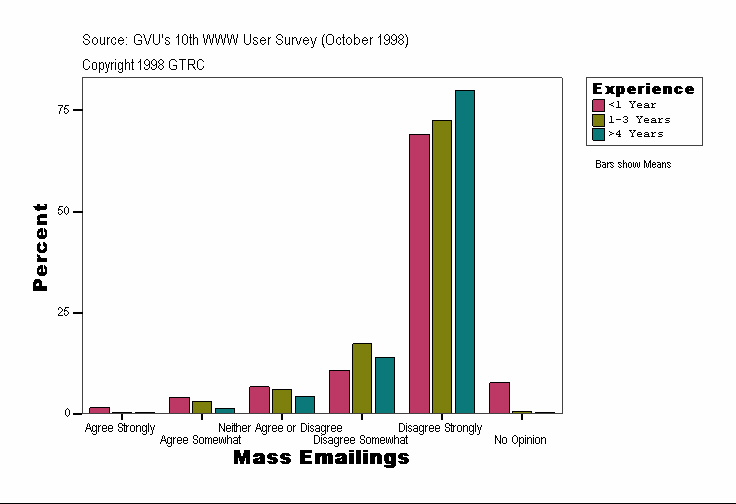
Mass Emailings
| Experience |
Frequency |
Percent |
Valid Percent |
Cumulative Percent |
|---|
| . |
Valid |
Agree Strongly |
1
| 4.2
| 4.2
| 4.2
|
|---|
| Agree Somewhat |
2
| 8.3
| 8.3
| 12.5
|
|---|
| Neither Agree or Disagree |
4
| 16.7
| 16.7
| 29.2
|
|---|
| Disagree Somewhat |
2
| 8.3
| 8.3
| 37.5
|
|---|
| Disagree Strongly |
15
| 62.5
| 62.5
| 100.0
|
|---|
| Total |
24
| 100.0
| 100.0
|
|
|---|
| <1 Year |
Valid |
Agree Strongly |
3
| 1.5
| 1.5
| 1.5
|
|---|
| Agree Somewhat |
8
| 4.1
| 4.1
| 5.7
|
|---|
| Neither Agree or Disagree |
13
| 6.7
| 6.7
| 12.4
|
|---|
| Disagree Somewhat |
21
| 10.8
| 10.8
| 23.2
|
|---|
| Disagree Strongly |
134
| 69.1
| 69.1
| 92.3
|
|---|
| No Opinion |
15
| 7.7
| 7.7
| 100.0
|
|---|
| Total |
194
| 100.0
| 100.0
|
|
|---|
| 1-3 Years |
Valid |
Agree Strongly |
2
| .4
| .4
| .4
|
|---|
| Agree Somewhat |
14
| 3.1
| 3.1
| 3.6
|
|---|
| Neither Agree or Disagree |
27
| 6.1
| 6.1
| 9.6
|
|---|
| Disagree Somewhat |
77
| 17.3
| 17.3
| 26.9
|
|---|
| Disagree Strongly |
323
| 72.4
| 72.4
| 99.3
|
|---|
| No Opinion |
3
| .7
| .7
| 100.0
|
|---|
| Total |
446
| 100.0
| 100.0
|
|
|---|
| >4 Years |
Valid |
Agree Strongly |
2
| .2
| .2
| .2
|
|---|
| Agree Somewhat |
10
| 1.2
| 1.2
| 1.5
|
|---|
| Neither Agree or Disagree |
36
| 4.4
| 4.4
| 5.9
|
|---|
| Disagree Somewhat |
114
| 13.9
| 13.9
| 19.8
|
|---|
| Disagree Strongly |
653
| 79.8
| 79.8
| 99.6
|
|---|
| No Opinion |
3
| .4
| .4
| 100.0
|
|---|
| Total |
818
| 100.0
| 100.0
|
|
|---|
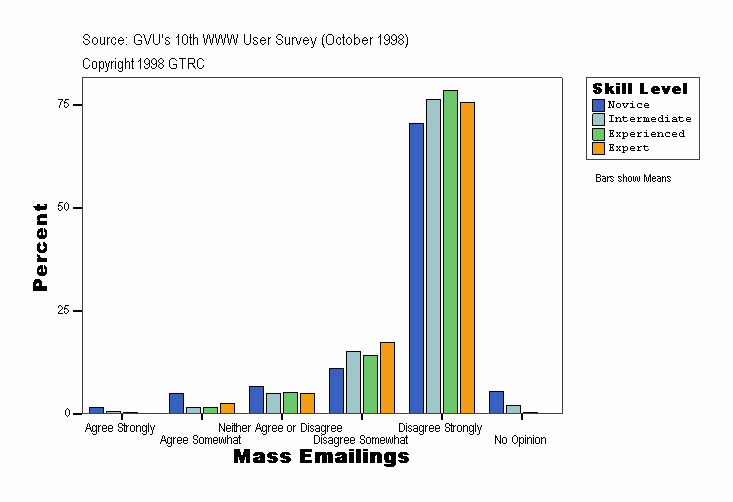
Mass Emailings
| Skill Level |
Frequency |
Percent |
Valid Percent |
Cumulative Percent |
|---|
| . |
Valid |
Agree Strongly |
1
| 4.2
| 4.2
| 4.2
|
|---|
| Agree Somewhat |
2
| 8.3
| 8.3
| 12.5
|
|---|
| Neither Agree or Disagree |
4
| 16.7
| 16.7
| 29.2
|
|---|
| Disagree Somewhat |
2
| 8.3
| 8.3
| 37.5
|
|---|
| Disagree Strongly |
15
| 62.5
| 62.5
| 100.0
|
|---|
| Total |
24
| 100.0
| 100.0
|
|
|---|
| Novice |
Valid |
Agree Strongly |
3
| 1.5
| 1.5
| 1.5
|
|---|
| Agree Somewhat |
10
| 5.0
| 5.0
| 6.5
|
|---|
| Neither Agree or Disagree |
13
| 6.5
| 6.5
| 13.0
|
|---|
| Disagree Somewhat |
22
| 11.0
| 11.0
| 24.0
|
|---|
| Disagree Strongly |
141
| 70.5
| 70.5
| 94.5
|
|---|
| No Opinion |
11
| 5.5
| 5.5
| 100.0
|
|---|
| Total |
200
| 100.0
| 100.0
|
|
|---|
| Intermediate |
Valid |
Agree Strongly |
2
| .5
| .5
| .5
|
|---|
| Agree Somewhat |
6
| 1.5
| 1.5
| 1.9
|
|---|
| Neither Agree or Disagree |
20
| 4.9
| 4.9
| 6.8
|
|---|
| Disagree Somewhat |
62
| 15.0
| 15.0
| 21.8
|
|---|
| Disagree Strongly |
314
| 76.2
| 76.2
| 98.1
|
|---|
| No Opinion |
8
| 1.9
| 1.9
| 100.0
|
|---|
| Total |
412
| 100.0
| 100.0
|
|
|---|
| Experienced |
Valid |
Agree Strongly |
2
| .4
| .4
| .4
|
|---|
| Agree Somewhat |
9
| 1.6
| 1.6
| 2.0
|
|---|
| Neither Agree or Disagree |
29
| 5.2
| 5.2
| 7.2
|
|---|
| Disagree Somewhat |
78
| 14.0
| 14.0
| 21.2
|
|---|
| Disagree Strongly |
436
| 78.4
| 78.4
| 99.6
|
|---|
| No Opinion |
2
| .4
| .4
| 100.0
|
|---|
| Total |
556
| 100.0
| 100.0
|
|
|---|
| Expert |
Valid |
Agree Somewhat |
7
| 2.4
| 2.4
| 2.4
|
|---|
| Neither Agree or Disagree |
14
| 4.8
| 4.8
| 7.2
|
|---|
| Disagree Somewhat |
50
| 17.2
| 17.2
| 24.5
|
|---|
| Disagree Strongly |
219
| 75.5
| 75.5
| 100.0
|
|---|
| Total |
290
| 100.0
| 100.0
|
|
|---|
Source: GVU's Tenth WWW User Survey (Conducted October 1998)
URL:http://www.gvu.gatech.edu/user_surveys/
Copyright 1998 GTRC - ALL RIGHTS RESERVED
Contact: www-survey@cc.gatech.edu
For more information or to submit comments:
send email to www-survey@cc.gatech.edu.
GVU's WWW Surveying Team
Graphics, Visualization, & Usability Center
College of Computing
Georgia Institute of Technology
Atlanta, GA 30332-0280
