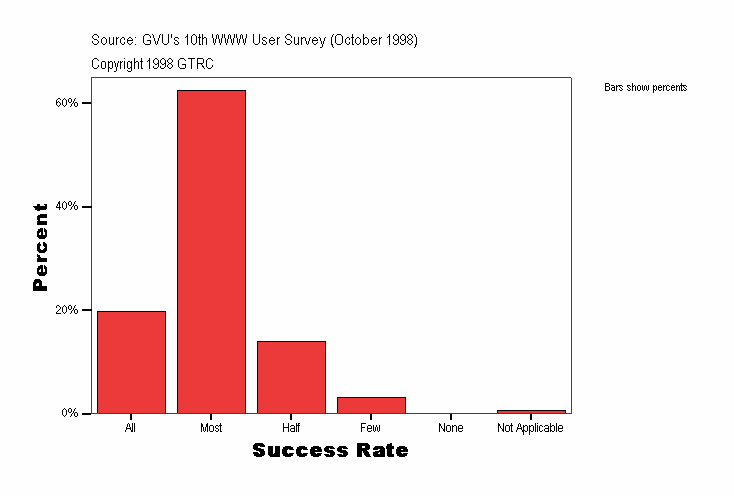
Success Rate
|
Frequency |
Percent |
Valid Percent |
Cumulative Percent |
|---|
| Valid |
All |
31
| 19.7
| 19.7
| 19.7
|
|---|
| Most |
98
| 62.4
| 62.4
| 82.2
|
|---|
| Half |
22
| 14.0
| 14.0
| 96.2
|
|---|
| Few |
5
| 3.2
| 3.2
| 99.4
|
|---|
| Not Applicable |
1
| .6
| .6
| 100.0
|
|---|
| Total |
157
| 100.0
| 100.0
|
|
|---|
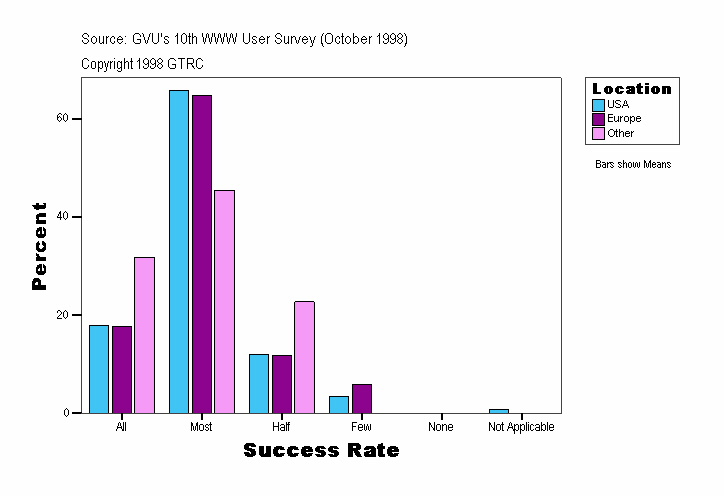
Success Rate
| Location |
Frequency |
Percent |
Valid Percent |
Cumulative Percent |
|---|
| . |
Valid |
Half |
1
| 100.0
| 100.0
| 100.0
|
|---|
| USA |
Valid |
All |
21
| 17.9
| 17.9
| 17.9
|
|---|
| Most |
77
| 65.8
| 65.8
| 83.8
|
|---|
| Half |
14
| 12.0
| 12.0
| 95.7
|
|---|
| Few |
4
| 3.4
| 3.4
| 99.1
|
|---|
| Not Applicable |
1
| .9
| .9
| 100.0
|
|---|
| Total |
117
| 100.0
| 100.0
|
|
|---|
| Europe |
Valid |
All |
3
| 17.6
| 17.6
| 17.6
|
|---|
| Most |
11
| 64.7
| 64.7
| 82.4
|
|---|
| Half |
2
| 11.8
| 11.8
| 94.1
|
|---|
| Few |
1
| 5.9
| 5.9
| 100.0
|
|---|
| Total |
17
| 100.0
| 100.0
|
|
|---|
| Other |
Valid |
All |
7
| 31.8
| 31.8
| 31.8
|
|---|
| Most |
10
| 45.5
| 45.5
| 77.3
|
|---|
| Half |
5
| 22.7
| 22.7
| 100.0
|
|---|
| Total |
22
| 100.0
| 100.0
|
|
|---|
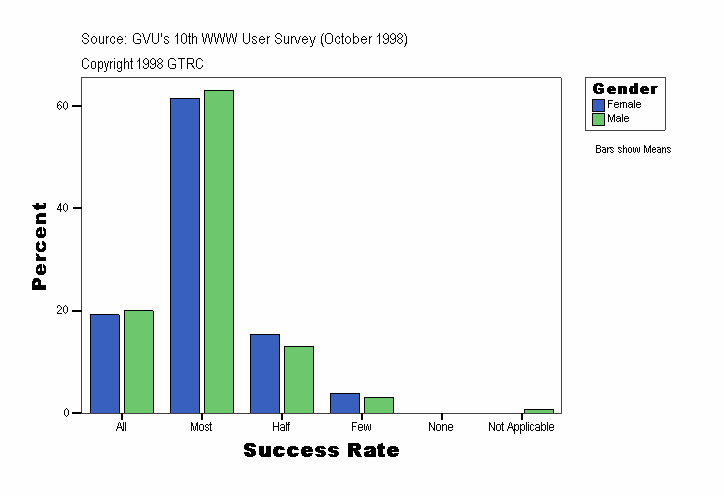
Success Rate
| Gender |
Frequency |
Percent |
Valid Percent |
Cumulative Percent |
|---|
| . |
Valid |
Half |
1
| 100.0
| 100.0
| 100.0
|
|---|
| Female |
Valid |
All |
5
| 19.2
| 19.2
| 19.2
|
|---|
| Most |
16
| 61.5
| 61.5
| 80.8
|
|---|
| Half |
4
| 15.4
| 15.4
| 96.2
|
|---|
| Few |
1
| 3.8
| 3.8
| 100.0
|
|---|
| Total |
26
| 100.0
| 100.0
|
|
|---|
| Male |
Valid |
All |
26
| 20.0
| 20.0
| 20.0
|
|---|
| Most |
82
| 63.1
| 63.1
| 83.1
|
|---|
| Half |
17
| 13.1
| 13.1
| 96.2
|
|---|
| Few |
4
| 3.1
| 3.1
| 99.2
|
|---|
| Not Applicable |
1
| .8
| .8
| 100.0
|
|---|
| Total |
130
| 100.0
| 100.0
|
|
|---|
Success Rate
| Age Groups |
Frequency |
Percent |
Valid Percent |
Cumulative Percent |
|---|
| . |
Valid |
Most |
2
| 40.0
| 40.0
| 40.0
|
|---|
| Half |
3
| 60.0
| 60.0
| 100.0
|
|---|
| Total |
5
| 100.0
| 100.0
|
|
|---|
| 11-20 |
Valid |
All |
2
| 33.3
| 33.3
| 33.3
|
|---|
| Most |
4
| 66.7
| 66.7
| 100.0
|
|---|
| Total |
6
| 100.0
| 100.0
|
|
|---|
| 21-25 |
Valid |
All |
2
| 12.5
| 12.5
| 12.5
|
|---|
| Most |
10
| 62.5
| 62.5
| 75.0
|
|---|
| Half |
3
| 18.8
| 18.8
| 93.8
|
|---|
| Few |
1
| 6.3
| 6.3
| 100.0
|
|---|
| Total |
16
| 100.0
| 100.0
|
|
|---|
| 26-50 |
Valid |
All |
19
| 18.6
| 18.6
| 18.6
|
|---|
| Most |
68
| 66.7
| 66.7
| 85.3
|
|---|
| Half |
12
| 11.8
| 11.8
| 97.1
|
|---|
| Few |
2
| 2.0
| 2.0
| 99.0
|
|---|
| Not Applicable |
1
| 1.0
| 1.0
| 100.0
|
|---|
| Total |
102
| 100.0
| 100.0
|
|
|---|
| 50+ |
Valid |
All |
8
| 28.6
| 28.6
| 28.6
|
|---|
| Most |
14
| 50.0
| 50.0
| 78.6
|
|---|
| Half |
4
| 14.3
| 14.3
| 92.9
|
|---|
| Few |
2
| 7.1
| 7.1
| 100.0
|
|---|
| Total |
28
| 100.0
| 100.0
|
|
|---|
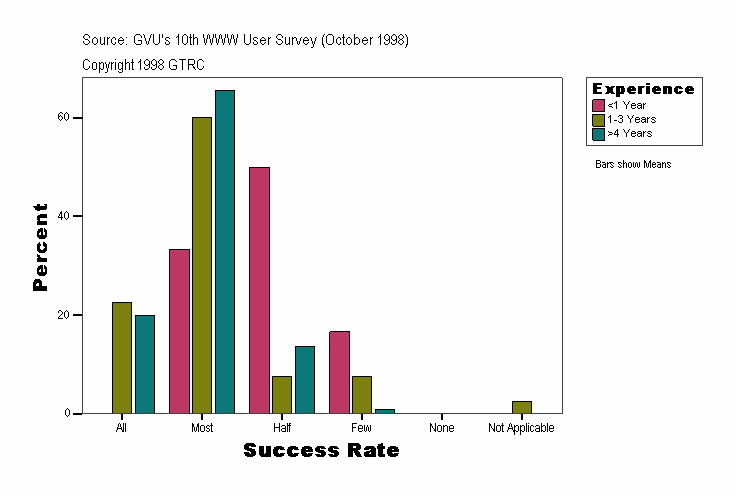
Success Rate
| Experience |
Frequency |
Percent |
Valid Percent |
Cumulative Percent |
|---|
| . |
Valid |
Half |
1
| 100.0
| 100.0
| 100.0
|
|---|
| <1 Year |
Valid |
Most |
2
| 33.3
| 33.3
| 33.3
|
|---|
| Half |
3
| 50.0
| 50.0
| 83.3
|
|---|
| Few |
1
| 16.7
| 16.7
| 100.0
|
|---|
| Total |
6
| 100.0
| 100.0
|
|
|---|
| 1-3 Years |
Valid |
All |
9
| 22.5
| 22.5
| 22.5
|
|---|
| Most |
24
| 60.0
| 60.0
| 82.5
|
|---|
| Half |
3
| 7.5
| 7.5
| 90.0
|
|---|
| Few |
3
| 7.5
| 7.5
| 97.5
|
|---|
| Not Applicable |
1
| 2.5
| 2.5
| 100.0
|
|---|
| Total |
40
| 100.0
| 100.0
|
|
|---|
| >4 Years |
Valid |
All |
22
| 20.0
| 20.0
| 20.0
|
|---|
| Most |
72
| 65.5
| 65.5
| 85.5
|
|---|
| Half |
15
| 13.6
| 13.6
| 99.1
|
|---|
| Few |
1
| .9
| .9
| 100.0
|
|---|
| Total |
110
| 100.0
| 100.0
|
|
|---|
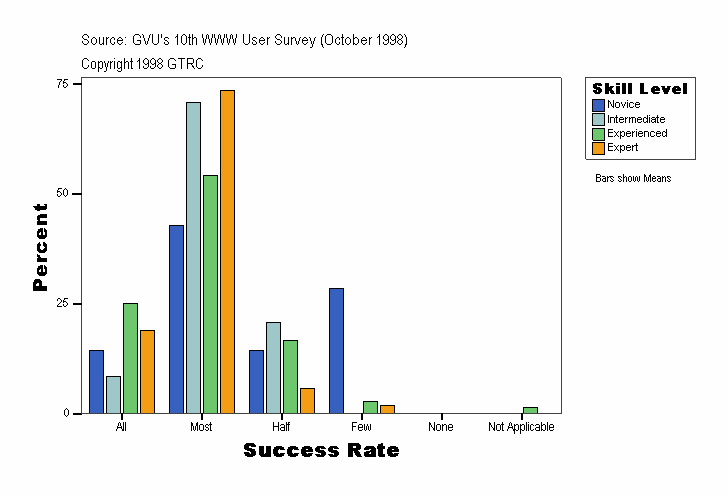
Success Rate
| Skill Level |
Frequency |
Percent |
Valid Percent |
Cumulative Percent |
|---|
| . |
Valid |
Half |
1
| 100.0
| 100.0
| 100.0
|
|---|
| Novice |
Valid |
All |
1
| 14.3
| 14.3
| 14.3
|
|---|
| Most |
3
| 42.9
| 42.9
| 57.1
|
|---|
| Half |
1
| 14.3
| 14.3
| 71.4
|
|---|
| Few |
2
| 28.6
| 28.6
| 100.0
|
|---|
| Total |
7
| 100.0
| 100.0
|
|
|---|
| Intermediate |
Valid |
All |
2
| 8.3
| 8.3
| 8.3
|
|---|
| Most |
17
| 70.8
| 70.8
| 79.2
|
|---|
| Half |
5
| 20.8
| 20.8
| 100.0
|
|---|
| Total |
24
| 100.0
| 100.0
|
|
|---|
| Experienced |
Valid |
All |
18
| 25.0
| 25.0
| 25.0
|
|---|
| Most |
39
| 54.2
| 54.2
| 79.2
|
|---|
| Half |
12
| 16.7
| 16.7
| 95.8
|
|---|
| Few |
2
| 2.8
| 2.8
| 98.6
|
|---|
| Not Applicable |
1
| 1.4
| 1.4
| 100.0
|
|---|
| Total |
72
| 100.0
| 100.0
|
|
|---|
| Expert |
Valid |
All |
10
| 18.9
| 18.9
| 18.9
|
|---|
| Most |
39
| 73.6
| 73.6
| 92.5
|
|---|
| Half |
3
| 5.7
| 5.7
| 98.1
|
|---|
| Few |
1
| 1.9
| 1.9
| 100.0
|
|---|
| Total |
53
| 100.0
| 100.0
|
|
|---|
Source: GVU's Tenth WWW User Survey (Conducted October 1998)
URL:http://www.gvu.gatech.edu/user_surveys/
Copyright 1998 GTRC - ALL RIGHTS RESERVED
Contact: www-survey@cc.gatech.edu
For more information or to submit comments:
send email to www-survey@cc.gatech.edu.
GVU's WWW Surveying Team
Graphics, Visualization, & Usability Center
College of Computing
Georgia Institute of Technology
Atlanta, GA 30332-0280
