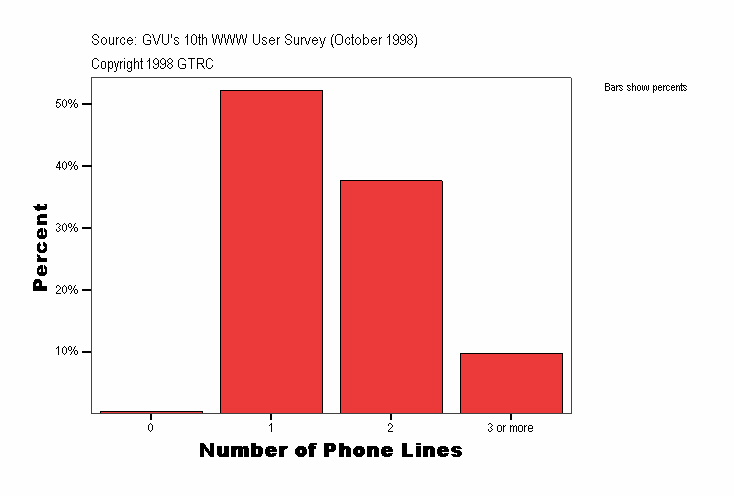
Number of Phone Lines
|
Frequency |
Percent |
Valid Percent |
Cumulative Percent |
|---|
| Valid |
0 |
10
| .4
| .4
| .4
|
|---|
| 1 |
1415
| 52.2
| 52.2
| 52.6
|
|---|
| 2 |
1020
| 37.6
| 37.6
| 90.2
|
|---|
| 3 or more |
265
| 9.8
| 9.8
| 100.0
|
|---|
| Total |
2710
| 100.0
| 100.0
|
|
|---|
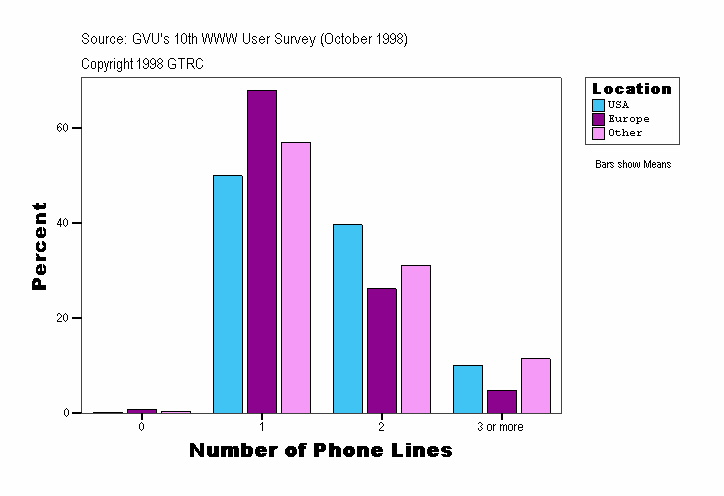
Number of Phone Lines
| Location |
Frequency |
Percent |
Valid Percent |
Cumulative Percent |
|---|
| . |
Valid |
0 |
1
| 2.9
| 2.9
| 2.9
|
|---|
| 1 |
20
| 58.8
| 58.8
| 61.8
|
|---|
| 2 |
10
| 29.4
| 29.4
| 91.2
|
|---|
| 3 or more |
3
| 8.8
| 8.8
| 100.0
|
|---|
| Total |
34
| 100.0
| 100.0
|
|
|---|
| USA |
Valid |
0 |
6
| .3
| .3
| .3
|
|---|
| 1 |
1103
| 50.0
| 50.0
| 50.2
|
|---|
| 2 |
875
| 39.6
| 39.6
| 89.9
|
|---|
| 3 or more |
223
| 10.1
| 10.1
| 100.0
|
|---|
| Total |
2207
| 100.0
| 100.0
|
|
|---|
| Europe |
Valid |
0 |
2
| .9
| .9
| .9
|
|---|
| 1 |
153
| 68.0
| 68.0
| 68.9
|
|---|
| 2 |
59
| 26.2
| 26.2
| 95.1
|
|---|
| 3 or more |
11
| 4.9
| 4.9
| 100.0
|
|---|
| Total |
225
| 100.0
| 100.0
|
|
|---|
| Other |
Valid |
0 |
1
| .4
| .4
| .4
|
|---|
| 1 |
139
| 57.0
| 57.0
| 57.4
|
|---|
| 2 |
76
| 31.1
| 31.1
| 88.5
|
|---|
| 3 or more |
28
| 11.5
| 11.5
| 100.0
|
|---|
| Total |
244
| 100.0
| 100.0
|
|
|---|
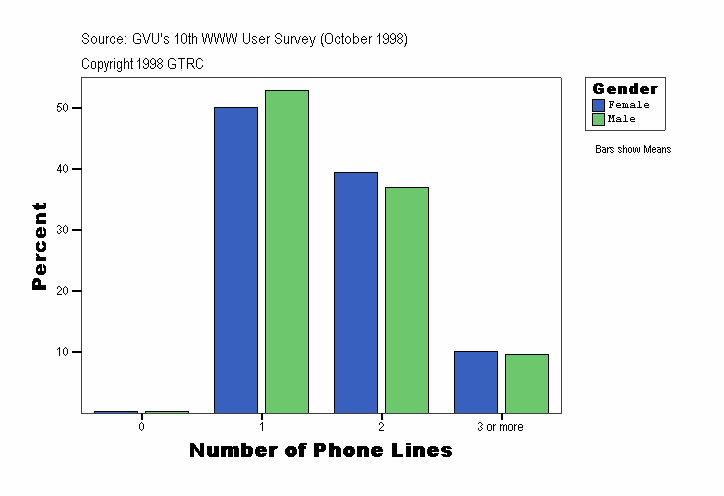
Number of Phone Lines
| Gender |
Frequency |
Percent |
Valid Percent |
Cumulative Percent |
|---|
| . |
Valid |
0 |
1
| 2.9
| 2.9
| 2.9
|
|---|
| 1 |
20
| 58.8
| 58.8
| 61.8
|
|---|
| 2 |
10
| 29.4
| 29.4
| 91.2
|
|---|
| 3 or more |
3
| 8.8
| 8.8
| 100.0
|
|---|
| Total |
34
| 100.0
| 100.0
|
|
|---|
| Female |
Valid |
0 |
2
| .3
| .3
| .3
|
|---|
| 1 |
387
| 50.1
| 50.1
| 50.4
|
|---|
| 2 |
305
| 39.5
| 39.5
| 89.9
|
|---|
| 3 or more |
78
| 10.1
| 10.1
| 100.0
|
|---|
| Total |
772
| 100.0
| 100.0
|
|
|---|
| Male |
Valid |
0 |
7
| .4
| .4
| .4
|
|---|
| 1 |
1008
| 52.9
| 52.9
| 53.3
|
|---|
| 2 |
705
| 37.0
| 37.0
| 90.3
|
|---|
| 3 or more |
184
| 9.7
| 9.7
| 100.0
|
|---|
| Total |
1904
| 100.0
| 100.0
|
|
|---|
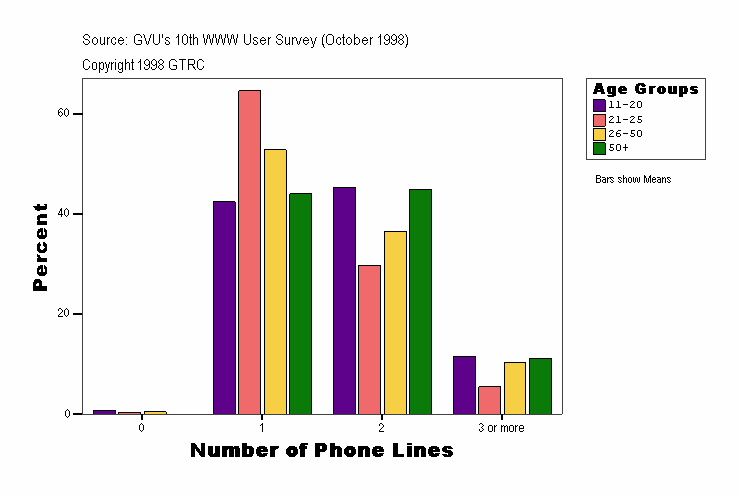
Number of Phone Lines
| Age Groups |
Frequency |
Percent |
Valid Percent |
Cumulative Percent |
|---|
| . |
Valid |
0 |
1
| 1.4
| 1.4
| 1.4
|
|---|
| 1 |
38
| 51.4
| 51.4
| 52.7
|
|---|
| 2 |
30
| 40.5
| 40.5
| 93.2
|
|---|
| 3 or more |
5
| 6.8
| 6.8
| 100.0
|
|---|
| Total |
74
| 100.0
| 100.0
|
|
|---|
| 11-20 |
Valid |
0 |
1
| .7
| .7
| .7
|
|---|
| 1 |
59
| 42.4
| 42.4
| 43.2
|
|---|
| 2 |
63
| 45.3
| 45.3
| 88.5
|
|---|
| 3 or more |
16
| 11.5
| 11.5
| 100.0
|
|---|
| Total |
139
| 100.0
| 100.0
|
|
|---|
| 21-25 |
Valid |
0 |
1
| .3
| .3
| .3
|
|---|
| 1 |
215
| 64.6
| 64.6
| 64.9
|
|---|
| 2 |
99
| 29.7
| 29.7
| 94.6
|
|---|
| 3 or more |
18
| 5.4
| 5.4
| 100.0
|
|---|
| Total |
333
| 100.0
| 100.0
|
|
|---|
| 26-50 |
Valid |
0 |
7
| .4
| .4
| .4
|
|---|
| 1 |
905
| 52.8
| 52.8
| 53.2
|
|---|
| 2 |
626
| 36.5
| 36.5
| 89.7
|
|---|
| 3 or more |
176
| 10.3
| 10.3
| 100.0
|
|---|
| Total |
1714
| 100.0
| 100.0
|
|
|---|
| 50+ |
Valid |
1 |
198
| 44.0
| 44.0
| 44.0
|
|---|
| 2 |
202
| 44.9
| 44.9
| 88.9
|
|---|
| 3 or more |
50
| 11.1
| 11.1
| 100.0
|
|---|
| Total |
450
| 100.0
| 100.0
|
|
|---|
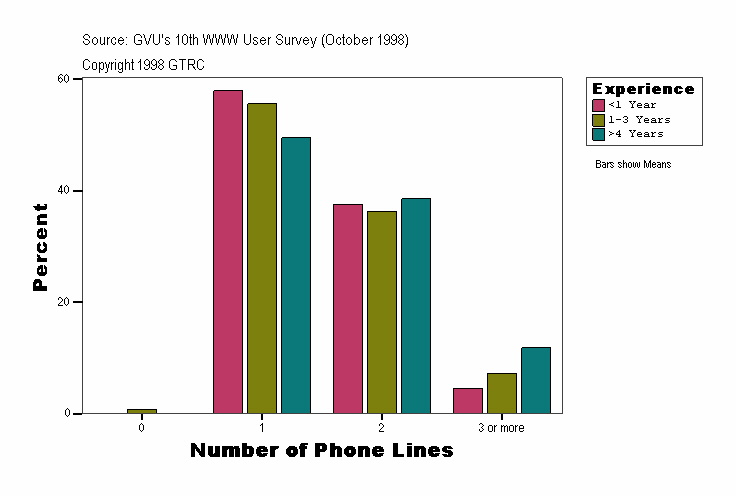
Number of Phone Lines
| Experience |
Frequency |
Percent |
Valid Percent |
Cumulative Percent |
|---|
| . |
Valid |
0 |
1
| 2.9
| 2.9
| 2.9
|
|---|
| 1 |
20
| 58.8
| 58.8
| 61.8
|
|---|
| 2 |
10
| 29.4
| 29.4
| 91.2
|
|---|
| 3 or more |
3
| 8.8
| 8.8
| 100.0
|
|---|
| Total |
34
| 100.0
| 100.0
|
|
|---|
| <1 Year |
Valid |
1 |
139
| 57.9
| 57.9
| 57.9
|
|---|
| 2 |
90
| 37.5
| 37.5
| 95.4
|
|---|
| 3 or more |
11
| 4.6
| 4.6
| 100.0
|
|---|
| Total |
240
| 100.0
| 100.0
|
|
|---|
| 1-3 Years |
Valid |
0 |
7
| .8
| .8
| .8
|
|---|
| 1 |
458
| 55.6
| 55.6
| 56.4
|
|---|
| 2 |
299
| 36.3
| 36.3
| 92.7
|
|---|
| 3 or more |
60
| 7.3
| 7.3
| 100.0
|
|---|
| Total |
824
| 100.0
| 100.0
|
|
|---|
| >4 Years |
Valid |
0 |
2
| .1
| .1
| .1
|
|---|
| 1 |
798
| 49.5
| 49.5
| 49.6
|
|---|
| 2 |
621
| 38.5
| 38.5
| 88.2
|
|---|
| 3 or more |
191
| 11.8
| 11.8
| 100.0
|
|---|
| Total |
1612
| 100.0
| 100.0
|
|
|---|
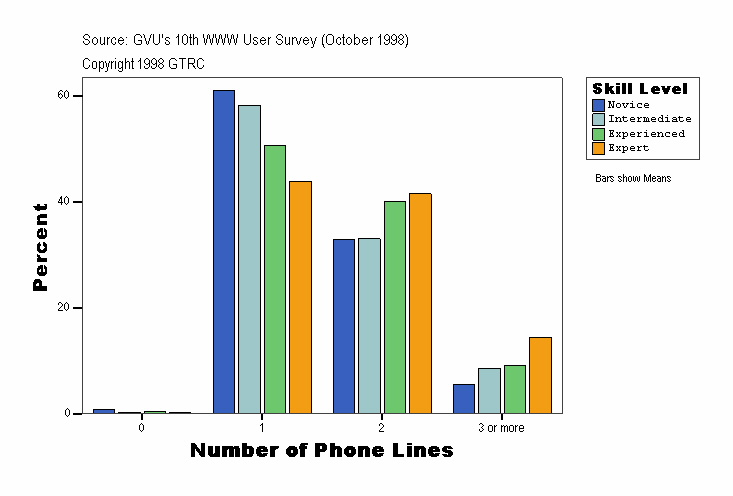
Number of Phone Lines
| Skill Level |
Frequency |
Percent |
Valid Percent |
Cumulative Percent |
|---|
| . |
Valid |
0 |
1
| 2.9
| 2.9
| 2.9
|
|---|
| 1 |
20
| 58.8
| 58.8
| 61.8
|
|---|
| 2 |
10
| 29.4
| 29.4
| 91.2
|
|---|
| 3 or more |
3
| 8.8
| 8.8
| 100.0
|
|---|
| Total |
34
| 100.0
| 100.0
|
|
|---|
| Novice |
Valid |
0 |
2
| .8
| .8
| .8
|
|---|
| 1 |
156
| 60.9
| 60.9
| 61.7
|
|---|
| 2 |
84
| 32.8
| 32.8
| 94.5
|
|---|
| 3 or more |
14
| 5.5
| 5.5
| 100.0
|
|---|
| Total |
256
| 100.0
| 100.0
|
|
|---|
| Intermediate |
Valid |
0 |
2
| .3
| .3
| .3
|
|---|
| 1 |
416
| 58.2
| 58.2
| 58.5
|
|---|
| 2 |
236
| 33.0
| 33.0
| 91.5
|
|---|
| 3 or more |
61
| 8.5
| 8.5
| 100.0
|
|---|
| Total |
715
| 100.0
| 100.0
|
|
|---|
| Experienced |
Valid |
0 |
4
| .4
| .4
| .4
|
|---|
| 1 |
568
| 50.5
| 50.5
| 50.9
|
|---|
| 2 |
449
| 39.9
| 39.9
| 90.8
|
|---|
| 3 or more |
103
| 9.2
| 9.2
| 100.0
|
|---|
| Total |
1124
| 100.0
| 100.0
|
|
|---|
| Expert |
Valid |
0 |
1
| .2
| .2
| .2
|
|---|
| 1 |
255
| 43.9
| 43.9
| 44.1
|
|---|
| 2 |
241
| 41.5
| 41.5
| 85.5
|
|---|
| 3 or more |
84
| 14.5
| 14.5
| 100.0
|
|---|
| Total |
581
| 100.0
| 100.0
|
|
|---|
Source: GVU's Tenth WWW User Survey (Conducted October 1998)
URL:http://www.gvu.gatech.edu/user_surveys/
Copyright 1998 GTRC - ALL RIGHTS RESERVED
Contact: www-survey@cc.gatech.edu
For more information or to submit comments:
send email to www-survey@cc.gatech.edu.
GVU's WWW Surveying Team
Graphics, Visualization, & Usability Center
College of Computing
Georgia Institute of Technology
Atlanta, GA 30332-0280
