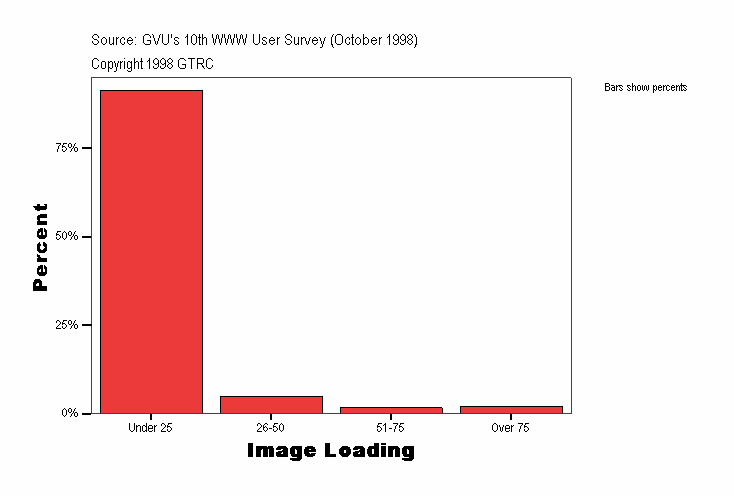
Image Loading
|
Frequency |
Percent |
Valid Percent |
Cumulative Percent |
|---|
| Valid |
Under 25 |
3005
| 91.3
| 91.3
| 91.3
|
|---|
| 26-50 |
164
| 5.0
| 5.0
| 96.3
|
|---|
| 51-75 |
55
| 1.7
| 1.7
| 98.0
|
|---|
| Over 75 |
67
| 2.0
| 2.0
| 100.0
|
|---|
| Total |
3291
| 100.0
| 100.0
|
|
|---|
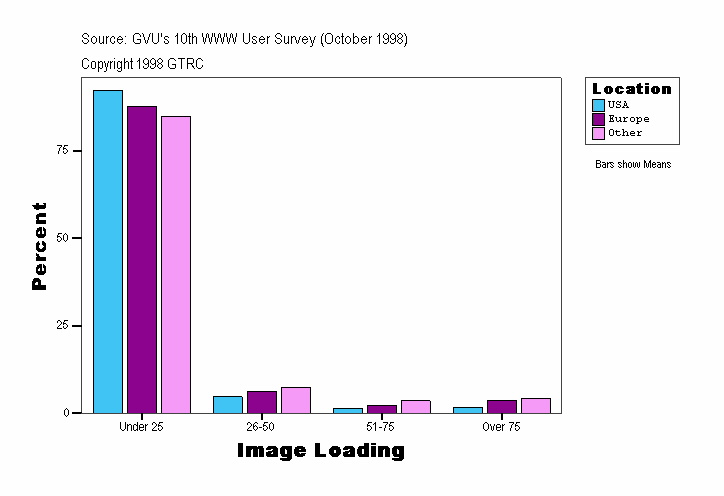
Image Loading
| Location |
Frequency |
Percent |
Valid Percent |
Cumulative Percent |
|---|
| . |
Valid |
Under 25 |
81
| 95.3
| 95.3
| 95.3
|
|---|
| 26-50 |
2
| 2.4
| 2.4
| 97.6
|
|---|
| 51-75 |
2
| 2.4
| 2.4
| 100.0
|
|---|
| Total |
85
| 100.0
| 100.0
|
|
|---|
| USA |
Valid |
Under 25 |
2448
| 92.2
| 92.2
| 92.2
|
|---|
| 26-50 |
124
| 4.7
| 4.7
| 96.9
|
|---|
| 51-75 |
37
| 1.4
| 1.4
| 98.3
|
|---|
| Over 75 |
45
| 1.7
| 1.7
| 100.0
|
|---|
| Total |
2654
| 100.0
| 100.0
|
|
|---|
| Europe |
Valid |
Under 25 |
235
| 87.7
| 87.7
| 87.7
|
|---|
| 26-50 |
17
| 6.3
| 6.3
| 94.0
|
|---|
| 51-75 |
6
| 2.2
| 2.2
| 96.3
|
|---|
| Over 75 |
10
| 3.7
| 3.7
| 100.0
|
|---|
| Total |
268
| 100.0
| 100.0
|
|
|---|
| Other |
Valid |
Under 25 |
241
| 84.9
| 84.9
| 84.9
|
|---|
| 26-50 |
21
| 7.4
| 7.4
| 92.3
|
|---|
| 51-75 |
10
| 3.5
| 3.5
| 95.8
|
|---|
| Over 75 |
12
| 4.2
| 4.2
| 100.0
|
|---|
| Total |
284
| 100.0
| 100.0
|
|
|---|
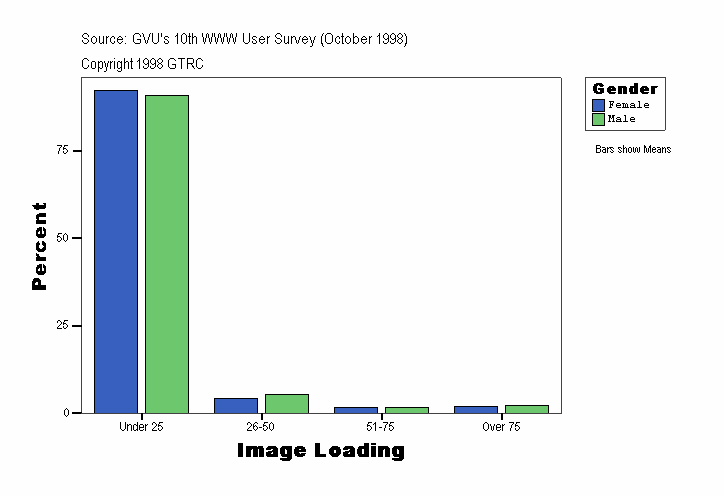
Image Loading
| Gender |
Frequency |
Percent |
Valid Percent |
Cumulative Percent |
|---|
| . |
Valid |
Under 25 |
81
| 95.3
| 95.3
| 95.3
|
|---|
| 26-50 |
2
| 2.4
| 2.4
| 97.6
|
|---|
| 51-75 |
2
| 2.4
| 2.4
| 100.0
|
|---|
| Total |
85
| 100.0
| 100.0
|
|
|---|
| Female |
Valid |
Under 25 |
957
| 92.2
| 92.2
| 92.2
|
|---|
| 26-50 |
43
| 4.1
| 4.1
| 96.3
|
|---|
| 51-75 |
17
| 1.6
| 1.6
| 98.0
|
|---|
| Over 75 |
21
| 2.0
| 2.0
| 100.0
|
|---|
| Total |
1038
| 100.0
| 100.0
|
|
|---|
| Male |
Valid |
Under 25 |
1967
| 90.7
| 90.7
| 90.7
|
|---|
| 26-50 |
119
| 5.5
| 5.5
| 96.2
|
|---|
| 51-75 |
36
| 1.7
| 1.7
| 97.9
|
|---|
| Over 75 |
46
| 2.1
| 2.1
| 100.0
|
|---|
| Total |
2168
| 100.0
| 100.0
|
|
|---|
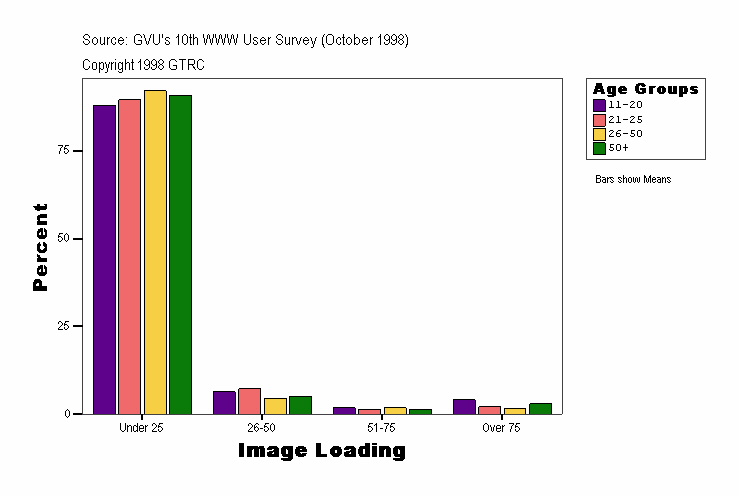
Image Loading
| Age Groups |
Frequency |
Percent |
Valid Percent |
Cumulative Percent |
|---|
| . |
Valid |
Under 25 |
117
| 91.4
| 91.4
| 91.4
|
|---|
| 26-50 |
6
| 4.7
| 4.7
| 96.1
|
|---|
| 51-75 |
3
| 2.3
| 2.3
| 98.4
|
|---|
| Over 75 |
2
| 1.6
| 1.6
| 100.0
|
|---|
| Total |
128
| 100.0
| 100.0
|
|
|---|
| 11-20 |
Valid |
Under 25 |
153
| 87.9
| 87.9
| 87.9
|
|---|
| 26-50 |
11
| 6.3
| 6.3
| 94.3
|
|---|
| 51-75 |
3
| 1.7
| 1.7
| 96.0
|
|---|
| Over 75 |
7
| 4.0
| 4.0
| 100.0
|
|---|
| Total |
174
| 100.0
| 100.0
|
|
|---|
| 21-25 |
Valid |
Under 25 |
350
| 89.5
| 89.5
| 89.5
|
|---|
| 26-50 |
28
| 7.2
| 7.2
| 96.7
|
|---|
| 51-75 |
5
| 1.3
| 1.3
| 98.0
|
|---|
| Over 75 |
8
| 2.0
| 2.0
| 100.0
|
|---|
| Total |
391
| 100.0
| 100.0
|
|
|---|
| 26-50 |
Valid |
Under 25 |
1891
| 92.1
| 92.1
| 92.1
|
|---|
| 26-50 |
92
| 4.5
| 4.5
| 96.5
|
|---|
| 51-75 |
37
| 1.8
| 1.8
| 98.3
|
|---|
| Over 75 |
34
| 1.7
| 1.7
| 100.0
|
|---|
| Total |
2054
| 100.0
| 100.0
|
|
|---|
| 50+ |
Valid |
Under 25 |
494
| 90.8
| 90.8
| 90.8
|
|---|
| 26-50 |
27
| 5.0
| 5.0
| 95.8
|
|---|
| 51-75 |
7
| 1.3
| 1.3
| 97.1
|
|---|
| Over 75 |
16
| 2.9
| 2.9
| 100.0
|
|---|
| Total |
544
| 100.0
| 100.0
|
|
|---|
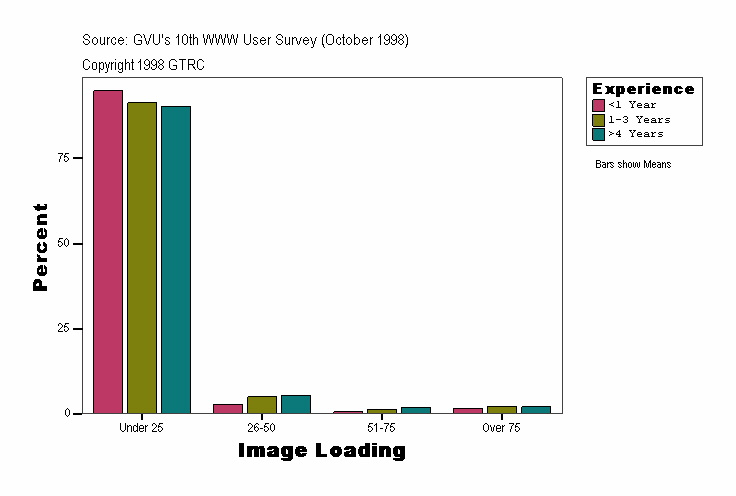
Image Loading
| Experience |
Frequency |
Percent |
Valid Percent |
Cumulative Percent |
|---|
| . |
Valid |
Under 25 |
81
| 95.3
| 95.3
| 95.3
|
|---|
| 26-50 |
2
| 2.4
| 2.4
| 97.6
|
|---|
| 51-75 |
2
| 2.4
| 2.4
| 100.0
|
|---|
| Total |
85
| 100.0
| 100.0
|
|
|---|
| <1 Year |
Valid |
Under 25 |
334
| 94.9
| 94.9
| 94.9
|
|---|
| 26-50 |
10
| 2.8
| 2.8
| 97.7
|
|---|
| 51-75 |
2
| .6
| .6
| 98.3
|
|---|
| Over 75 |
6
| 1.7
| 1.7
| 100.0
|
|---|
| Total |
352
| 100.0
| 100.0
|
|
|---|
| 1-3 Years |
Valid |
Under 25 |
970
| 91.3
| 91.3
| 91.3
|
|---|
| 26-50 |
53
| 5.0
| 5.0
| 96.3
|
|---|
| 51-75 |
15
| 1.4
| 1.4
| 97.7
|
|---|
| Over 75 |
24
| 2.3
| 2.3
| 100.0
|
|---|
| Total |
1062
| 100.0
| 100.0
|
|
|---|
| >4 Years |
Valid |
Under 25 |
1620
| 90.4
| 90.4
| 90.4
|
|---|
| 26-50 |
99
| 5.5
| 5.5
| 95.9
|
|---|
| 51-75 |
36
| 2.0
| 2.0
| 97.9
|
|---|
| Over 75 |
37
| 2.1
| 2.1
| 100.0
|
|---|
| Total |
1792
| 100.0
| 100.0
|
|
|---|
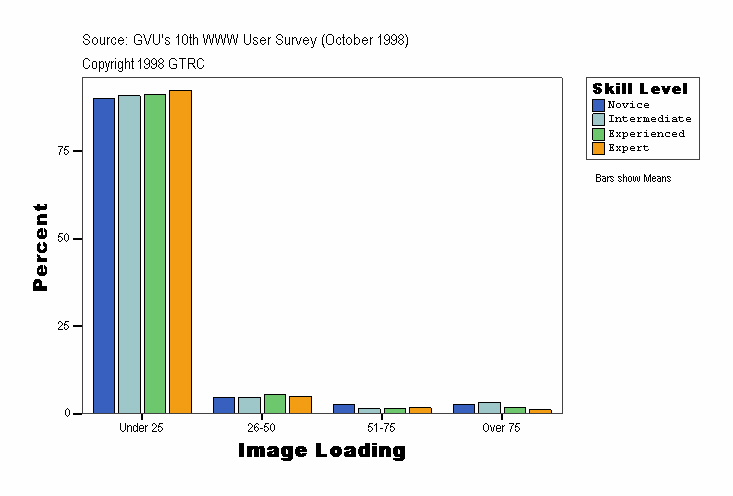
Image Loading
| Skill Level |
Frequency |
Percent |
Valid Percent |
Cumulative Percent |
|---|
| . |
Valid |
Under 25 |
81
| 95.3
| 95.3
| 95.3
|
|---|
| 26-50 |
2
| 2.4
| 2.4
| 97.6
|
|---|
| 51-75 |
2
| 2.4
| 2.4
| 100.0
|
|---|
| Total |
85
| 100.0
| 100.0
|
|
|---|
| Novice |
Valid |
Under 25 |
330
| 89.9
| 89.9
| 89.9
|
|---|
| 26-50 |
17
| 4.6
| 4.6
| 94.6
|
|---|
| 51-75 |
10
| 2.7
| 2.7
| 97.3
|
|---|
| Over 75 |
10
| 2.7
| 2.7
| 100.0
|
|---|
| Total |
367
| 100.0
| 100.0
|
|
|---|
| Intermediate |
Valid |
Under 25 |
791
| 90.8
| 90.8
| 90.8
|
|---|
| 26-50 |
40
| 4.6
| 4.6
| 95.4
|
|---|
| 51-75 |
12
| 1.4
| 1.4
| 96.8
|
|---|
| Over 75 |
28
| 3.2
| 3.2
| 100.0
|
|---|
| Total |
871
| 100.0
| 100.0
|
|
|---|
| Experienced |
Valid |
Under 25 |
1203
| 91.3
| 91.3
| 91.3
|
|---|
| 26-50 |
73
| 5.5
| 5.5
| 96.8
|
|---|
| 51-75 |
20
| 1.5
| 1.5
| 98.3
|
|---|
| Over 75 |
22
| 1.7
| 1.7
| 100.0
|
|---|
| Total |
1318
| 100.0
| 100.0
|
|
|---|
| Expert |
Valid |
Under 25 |
600
| 92.3
| 92.3
| 92.3
|
|---|
| 26-50 |
32
| 4.9
| 4.9
| 97.2
|
|---|
| 51-75 |
11
| 1.7
| 1.7
| 98.9
|
|---|
| Over 75 |
7
| 1.1
| 1.1
| 100.0
|
|---|
| Total |
650
| 100.0
| 100.0
|
|
|---|
Source: GVU's Tenth WWW User Survey (Conducted October 1998)
URL:http://www.gvu.gatech.edu/user_surveys/
Copyright 1998 GTRC - ALL RIGHTS RESERVED
Contact: www-survey@cc.gatech.edu
For more information or to submit comments:
send email to www-survey@cc.gatech.edu.
GVU's WWW Surveying Team
Graphics, Visualization, & Usability Center
College of Computing
Georgia Institute of Technology
Atlanta, GA 30332-0280
