Free Surface Hydrodynamic Motion Revealed
Leonard Imas, Vortical Flow Research (VFR) Laboratory in the
Ocean Engineering Department at the Massachusetts
Institute of Technology, Cambridge
Leonard Imas
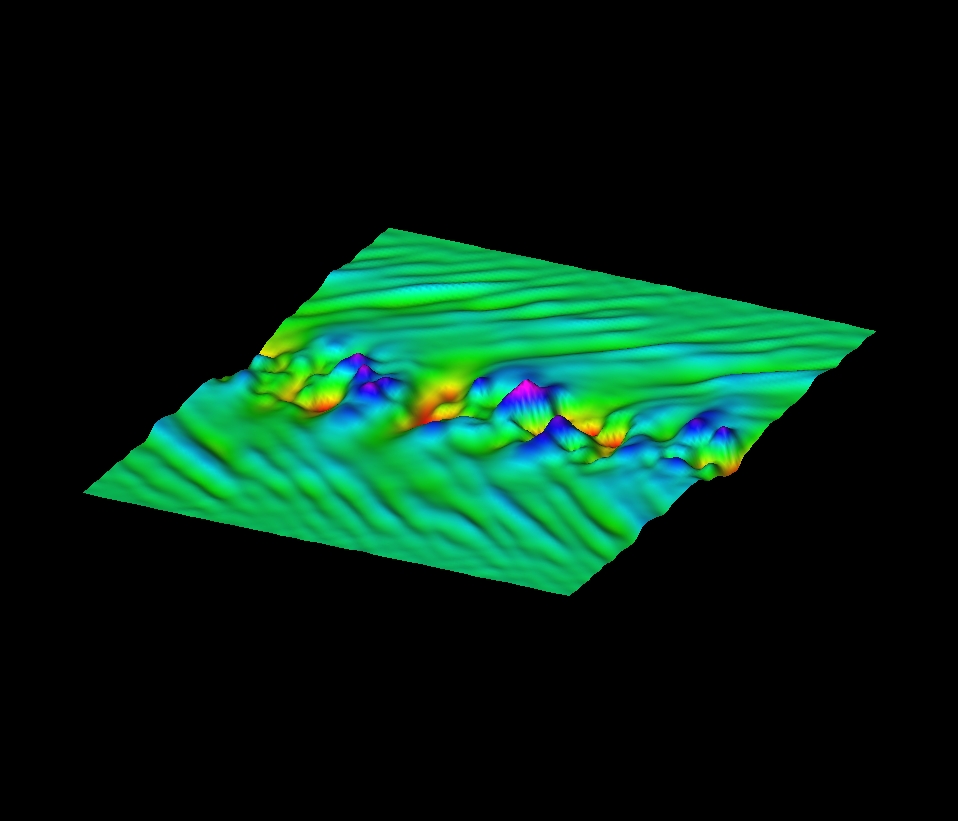
The study of free surface hydrodynamics - in particular the
examination and computerized visualization of free surface
turbulence, fish motion and fluid flow around ship hulls - are some
of the areas of study at the Vortical Flow Research (VFR) Laboratory
in the Ocean Engineering Department at the Massachusetts Institute
of Technology, Cambridge, Mass.
 Students in the lab are working to explain what's so special about
a fish's hydrodynamics that gives it what's called "high propulsive
efficiency." If the mechanics of fish swimming and maneuvering can
be understood, then those principles can be applied in designing
a submarine-type vehicle.
Students in the lab are working to explain what's so special about
a fish's hydrodynamics that gives it what's called "high propulsive
efficiency." If the mechanics of fish swimming and maneuvering can
be understood, then those principles can be applied in designing
a submarine-type vehicle.
Some of the students in the VFR lab also study hydrodynamics in the
immediate vicinity of a ship and the wakes it produces. Others look
at the waves behind ships, their wakes and their fluid mechanics.
Another topic of investigation in the department is accurate
determination of the forces acting on an object in the water. What
are the velocity distributions, pressure distributions, wave
resistance and wave loads?
 A comprehensive, computerized visualization tool is a useful aid
analyzing the above fluid dynamics data. For some of its visualiza-
tion tasks, the VFR lab has chosen IRIS Explorer. In the lab,
IRIS Explorer runs on a Silicon Graphics R8000 Power Indigo2. In
visualizing various aspects of their computational fluid dynamics
datasets, velocity fields, pressure contours and vorticity
isosurfaces, for example, the VFR lab's staff has found IRIS
Explorer very useful and important.
A comprehensive, computerized visualization tool is a useful aid
analyzing the above fluid dynamics data. For some of its visualiza-
tion tasks, the VFR lab has chosen IRIS Explorer. In the lab,
IRIS Explorer runs on a Silicon Graphics R8000 Power Indigo2. In
visualizing various aspects of their computational fluid dynamics
datasets, velocity fields, pressure contours and vorticity
isosurfaces, for example, the VFR lab's staff has found IRIS
Explorer very useful and important.
The visualization process begins with CFD code that models or
simulates how a fish swims or a ship moves through the ocean.
These simulations usually produce very large, three-dimensional
datasets that average 100 - 400 megabytes. Such a dataset may con-
tain information about the velocity and pressure fields around the
fish as well as the actual time-dependent geometry of the fish.
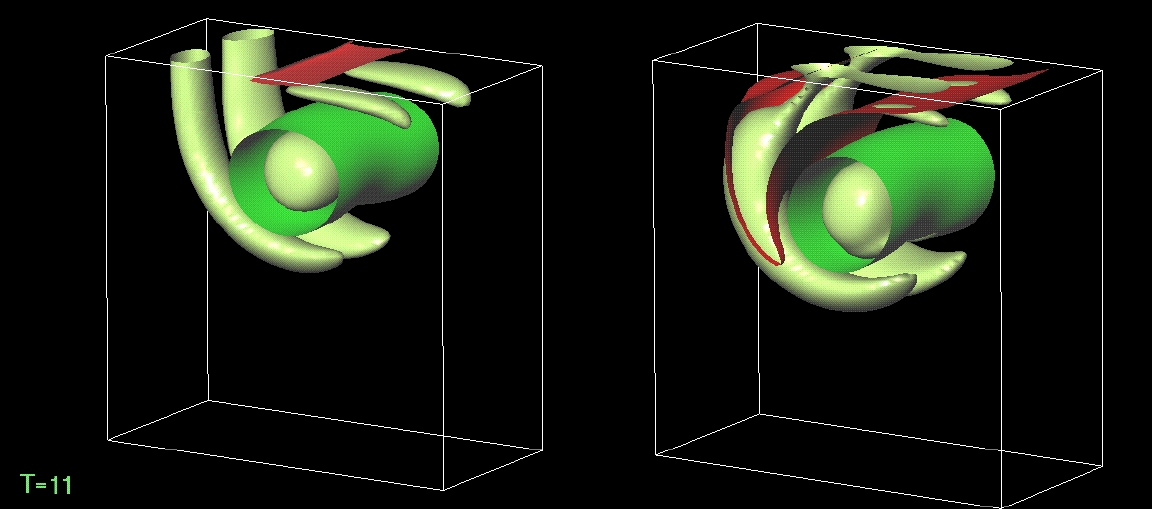
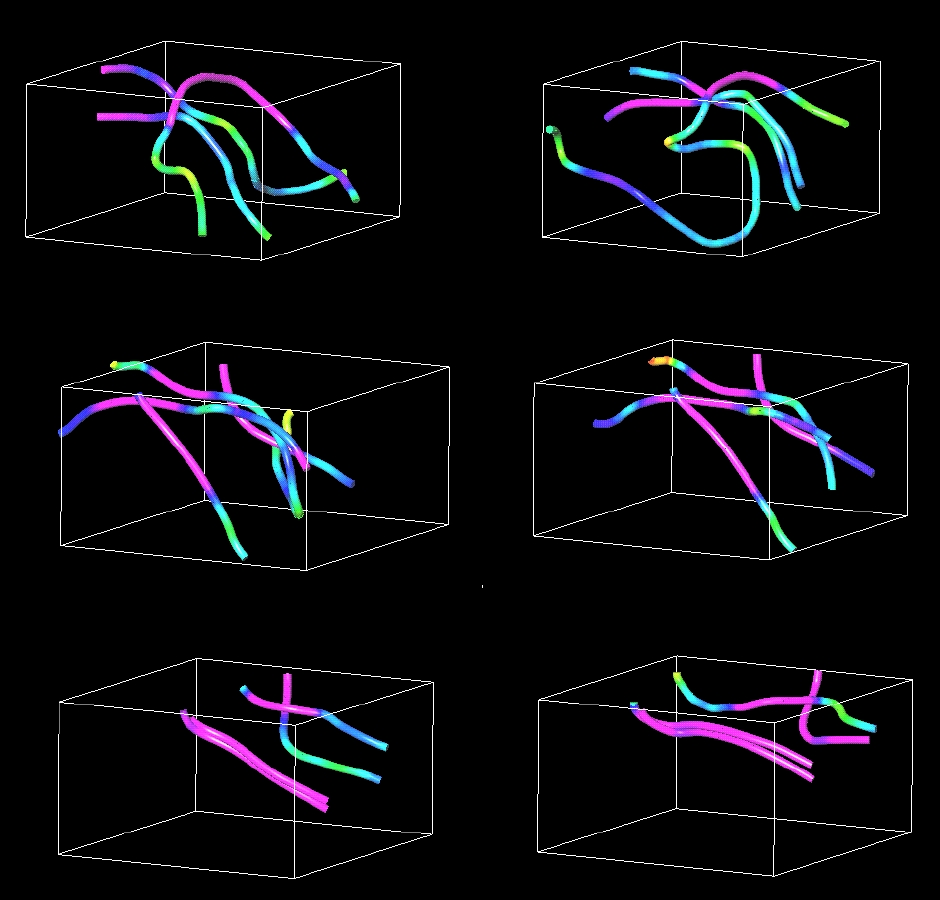
 With IRIS Explorer, the team can visualize these quantities: the
velocity field around the body is portrayed by small arrows of
differing colors that signify the changing speed of the fluid.
Contours and isosurfaces are used to depict pressure and vorticity
in the flow around the body. IRIS Explorer allows the users to load
an entire dataset - large or small - and then use a handy module to
take chunks of the data and render only those portions necessary.
Thus the staff can do data slicing to see contours of just one
variable at any particular point.
With IRIS Explorer, the team can visualize these quantities: the
velocity field around the body is portrayed by small arrows of
differing colors that signify the changing speed of the fluid.
Contours and isosurfaces are used to depict pressure and vorticity
in the flow around the body. IRIS Explorer allows the users to load
an entire dataset - large or small - and then use a handy module to
take chunks of the data and render only those portions necessary.
Thus the staff can do data slicing to see contours of just one
variable at any particular point.
Among the VFR Lab's preferred visualization routines are Vectors,
Streakline, Isosurface Lattice and OrthoSlice. Also, while a variety
of sample data input modules come with IE, the group prefers to
create their own modules with the software's unique application-
building abilities.
Leonard Imas of the VFR lab has found that IRIS Explorer is not one of
the more commonly found visualization packages written with a certain
application in mind, such as to see fluid flow around an aircraft or to
visualize seismic data. To look at flow involving free surfaces like the
ocean, many packages won't do what's needed. "I'm responsible for trying
out different packages," he says. "We've evaluated a number of other
fairly common 3D visualization packages. We didn't like one because it's
a NASA product geared primarily to observing flows around aircraft. If
your work is not in aircraft flow visualization, you must do extra work
to make your datasets work with this package. Another one was good but
way too expensive - even at the educational price level - and its
rendering quality is not as good as IRIS Explorer's. Others are also not
as intuitive as is IRIS Explorer."
 Accuracy is, of course, an extremely important element in scientific
and engineering studies such as these. IRIS Explorer includes modules
built on sophisticated algorithms from the NAG numerical library
known for its accuracy and reliability. The use of such a library
can save a developer time and effort in implementing fundamental
algorithms and allows concentration on other aspects of the
visualization process. Users can be confident that all modules
have been used in a wide range of other applications. In addition,
the library provides ready-made reference for documentation
purposes, which is key to assessing the accuracy and applicability
of the module.
Accuracy is, of course, an extremely important element in scientific
and engineering studies such as these. IRIS Explorer includes modules
built on sophisticated algorithms from the NAG numerical library
known for its accuracy and reliability. The use of such a library
can save a developer time and effort in implementing fundamental
algorithms and allows concentration on other aspects of the
visualization process. Users can be confident that all modules
have been used in a wide range of other applications. In addition,
the library provides ready-made reference for documentation
purposes, which is key to assessing the accuracy and applicability
of the module.
As for output, whenever the department reports its findings in
technical publications and at conferences, IRIS Explorer is used to
generate images for illustrative purposes.
"IRIS Explorer is very easy for us to use because it's intuitive," says
Imas. "It helps a user find what he or she needs to do to look at data.
This is because IE is a highly flexible visualization package consisting
of a wide variety of building blocks users can link together any way they
want - whatever arrangement gives them the output they desire."
"There is very little constraint on what users can and cannot do,"
states Imas. "We really like the flexibility of IRIS Explorer."
Last modified: Fri Jan 10 14:56:46 1997
[ Posters Home ]
© The Numerical Algorithms Group Ltd, Oxford UK, 1996.
 Students in the lab are working to explain what's so special about
a fish's hydrodynamics that gives it what's called "high propulsive
efficiency." If the mechanics of fish swimming and maneuvering can
be understood, then those principles can be applied in designing
a submarine-type vehicle.
Students in the lab are working to explain what's so special about
a fish's hydrodynamics that gives it what's called "high propulsive
efficiency." If the mechanics of fish swimming and maneuvering can
be understood, then those principles can be applied in designing
a submarine-type vehicle.