![]()
|
Jigsaw Home |
System Views |
Video Tutorial |
Example Document Sets |
In the News |
VAST '07 Contest |
Getting Jigsaw
|
|
Jigsaw: Visual Analytics for Exploring and Understanding Document Collections |
Team Members:
John Stasko,
Carsten Görg,
Zhicheng Liu,
Sakshi Pratap,
Anand Sainath
Alumni:
Meekal Bajaj,
Alex Humesky,
Mohit Jain,
Youn-ah Kang,
Jaeyeon Kihm,
Vasili Pantazopoulos,
Neel Parekh,
Roger Pincombe,
Kanupriya Singhal,
Gennadiy Stepanov,
Chad Stolper,
Xin Sun,
Sarah Williams

 Using Jigsaw, we won
the university division of the
Using Jigsaw, we won
the university division of the |
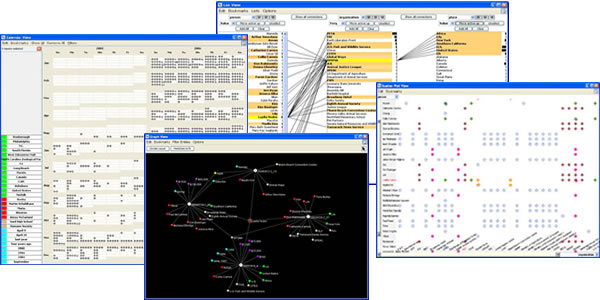
Summary We have created Jigsaw, a visual analytics system to help analysts and researchers better explore, analyze, and make sense of such document collections. Our specific objective is to help analysts reach more timely and accurate understandings of the larger stories and important concepts embedded throughout textual reports. Jigsaw provides a collection of visualizations that each portray different aspects of the documents. We particularly focus on presenting the identifiable important entities (people, places, organizations, etc.) and their direct or indirect connections. Textual processing extracts the important entities from the documents and then the visualizations help an analyst to explore the relationships and connections among the entities. The system includes a variety of visualizations such as list, graph, temproal and connection-based views, as well as views of individual document's text and the document collection as a whole. Jigsaw essentially acts as a visual index onto the document collection, helping analysts identify particular documents to read and examine next. We have used Jigsaw to explore a wide variety of domains and document collections including academic papers, grants, product reviews, business press releases, news articles, intelligence and police reports, statutes, and even books such as the Bible. Jigsaw is available for you to try and use on your own documents and data. For a good, short (2-page) overview of Jigsaw's goals and methods, please see the Spring 2008 VacViews article about the system. We have written and presented a number of academic papers about Jigsaw. To gain a good understanding of Jigsaw, please read the introductory 2008 Information Visualization journal article and the more recent 2013 IEEE TVCG journal article about how we combine computational analysis of document text with interactive visualization in the system. To learn more about the system's details and its different visualizations, please examine the Jigsaw views page. And to see the system in action, explore the scenario videos listed up above on this webpage or examine the video tutorial page.
Using Jigsaw as an analytic aid, we entered and won the university division of the VAST 2007 Contest. To learn more about our contest entry, visit the Contest Summary page.
The picture below shows Jigsaw being used on a computer with four monitors presenting the different system views. The multitude of views in the system makes a mutliple monitor computer like this desirable for analysis. 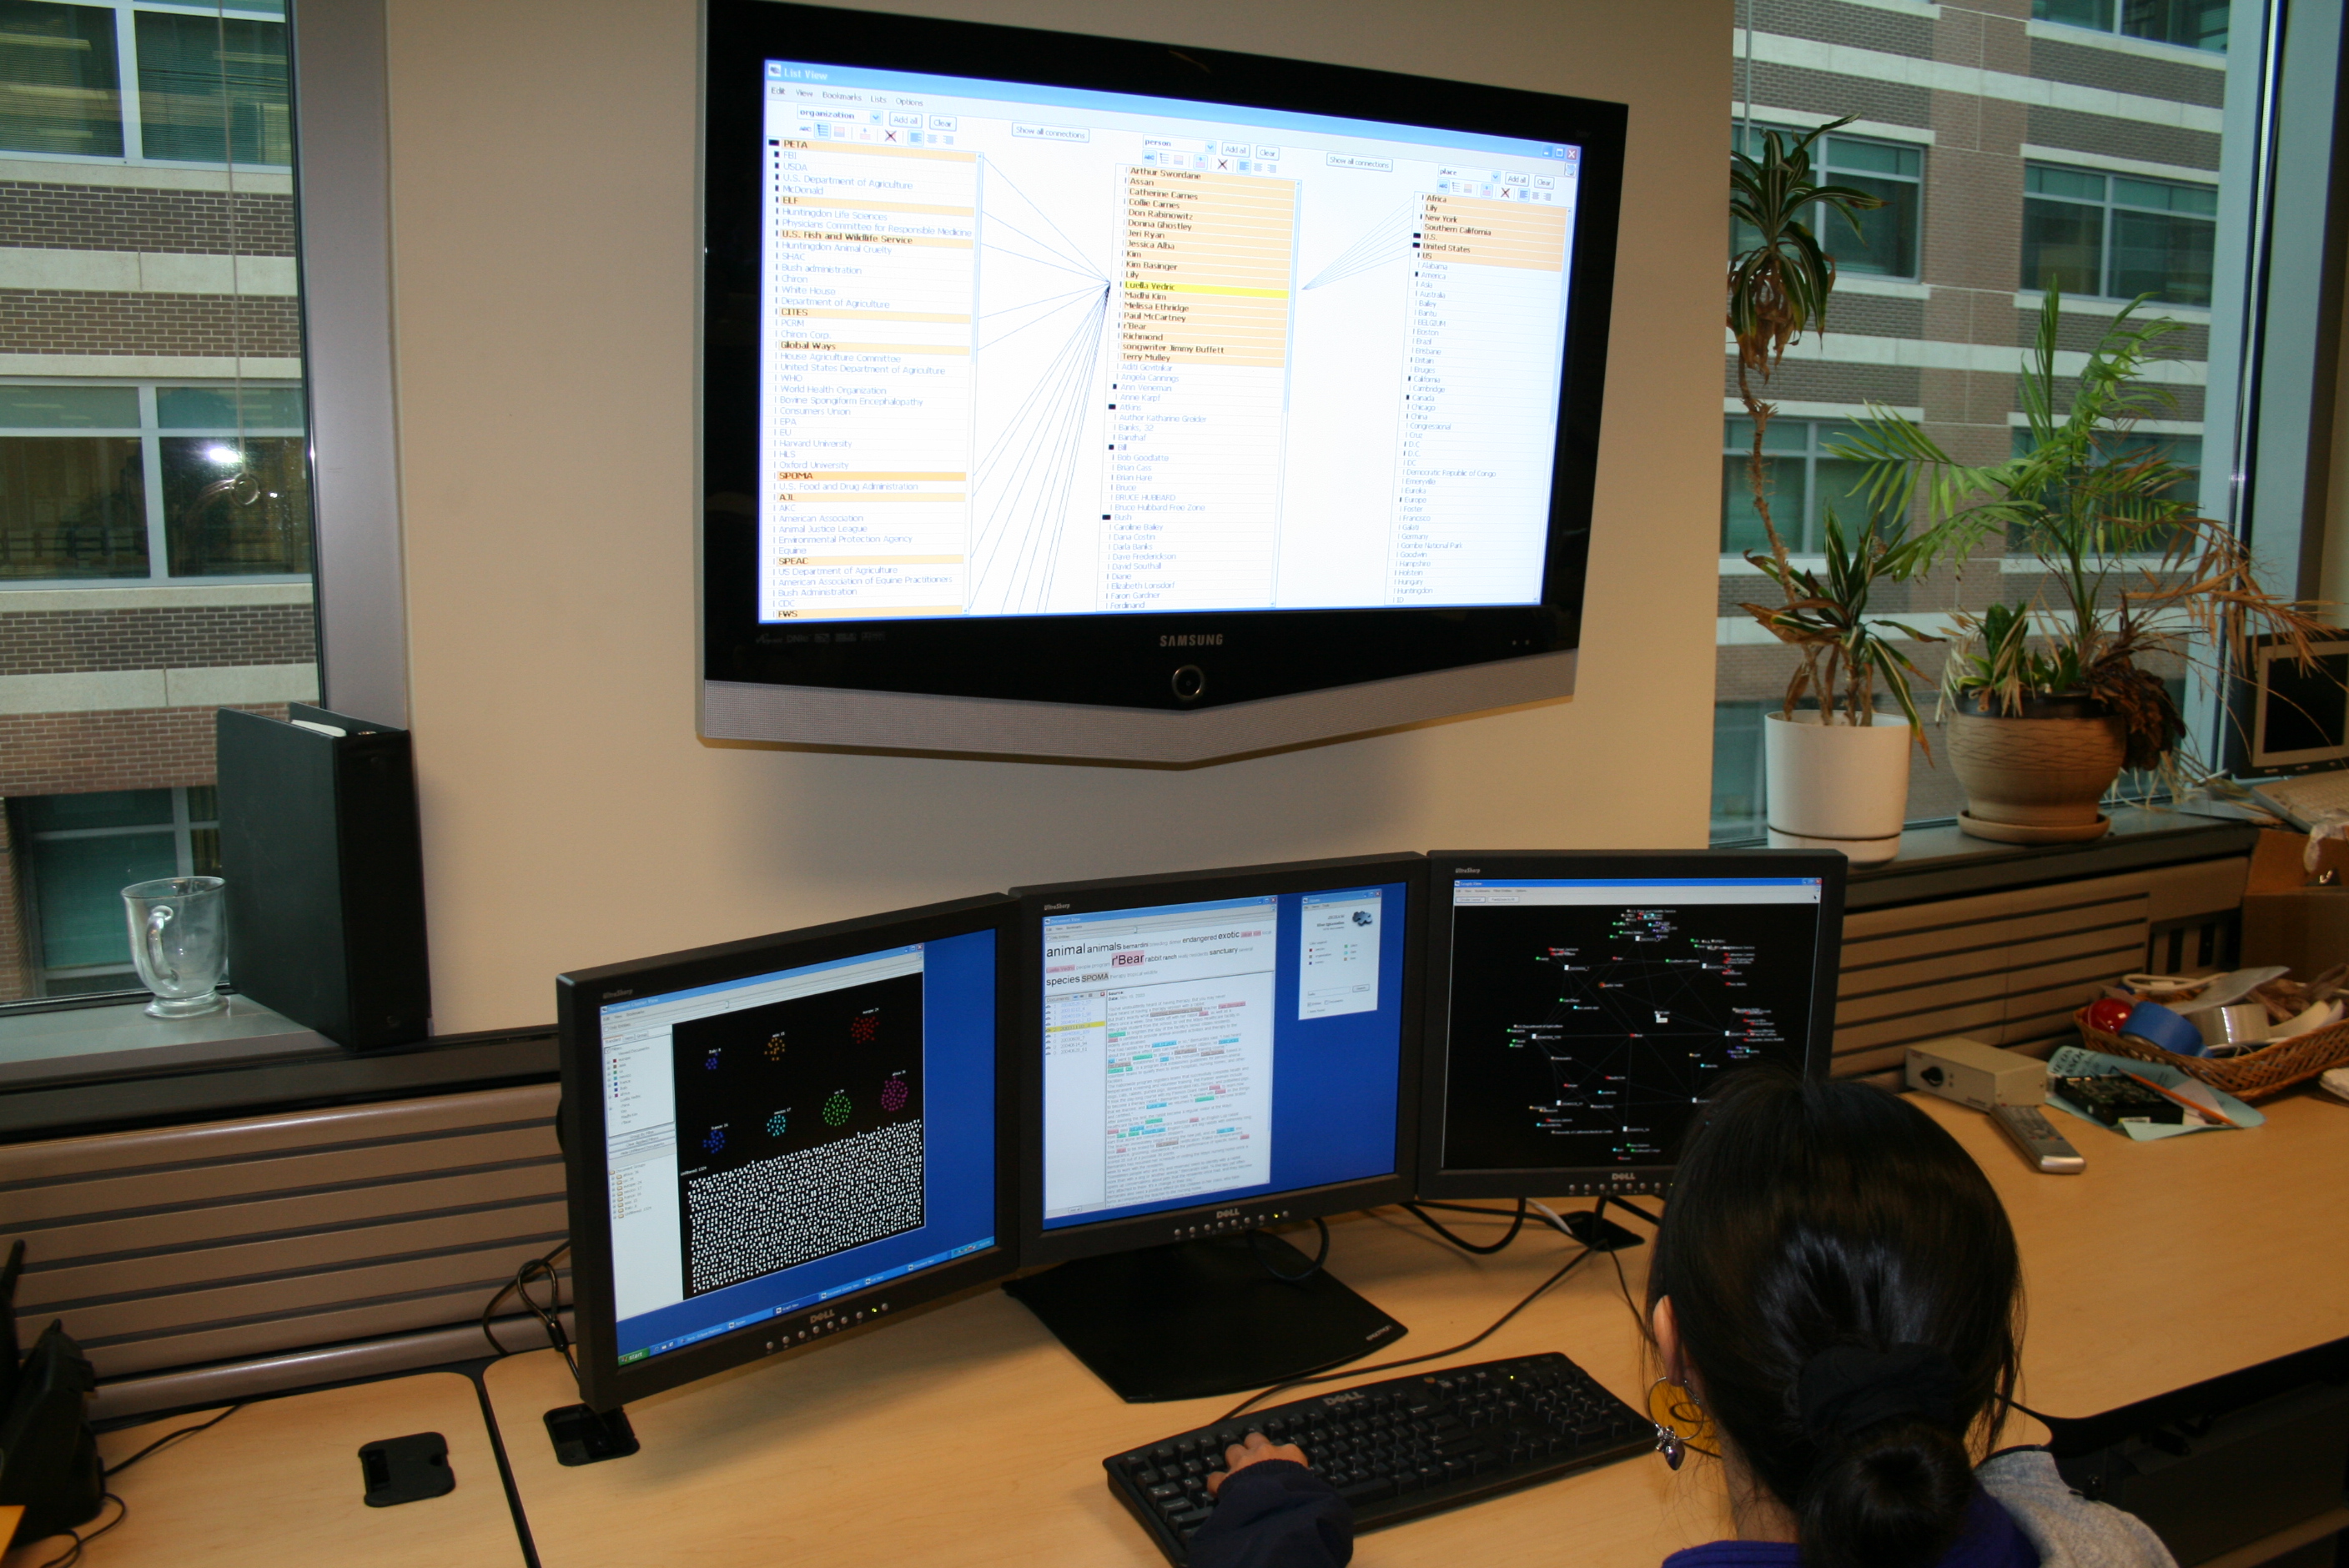
If four monitors aren't enough, Jigsaw can really hum on a display wall. The picture below shows Carsten demonstrating Jigsaw running on the PowerWall at Konstanz University (Germany) in Daniel Keim's lab. 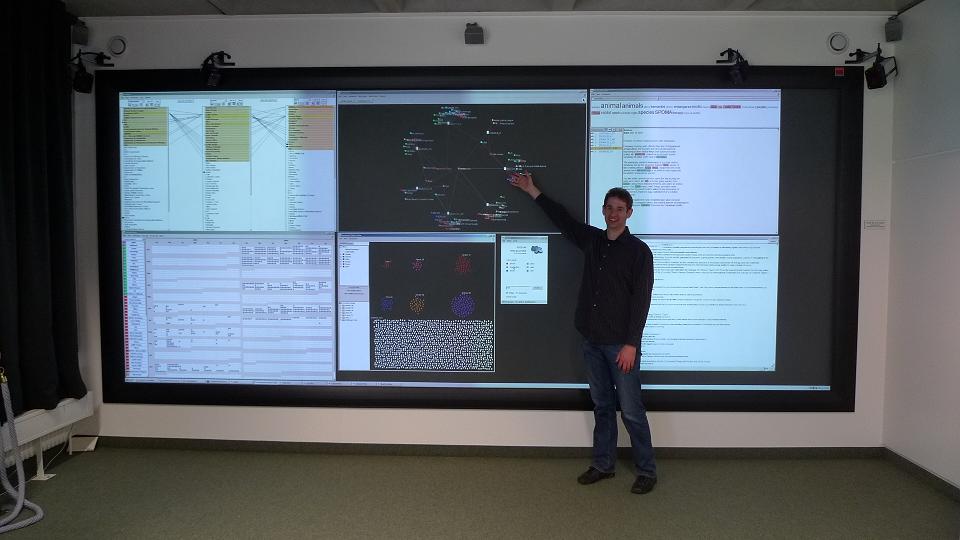
Below is a picture of John demonstrating Jigsaw to Tim Collins of Purdue at the 2009 NVAC Consortium meeting at PNNL. 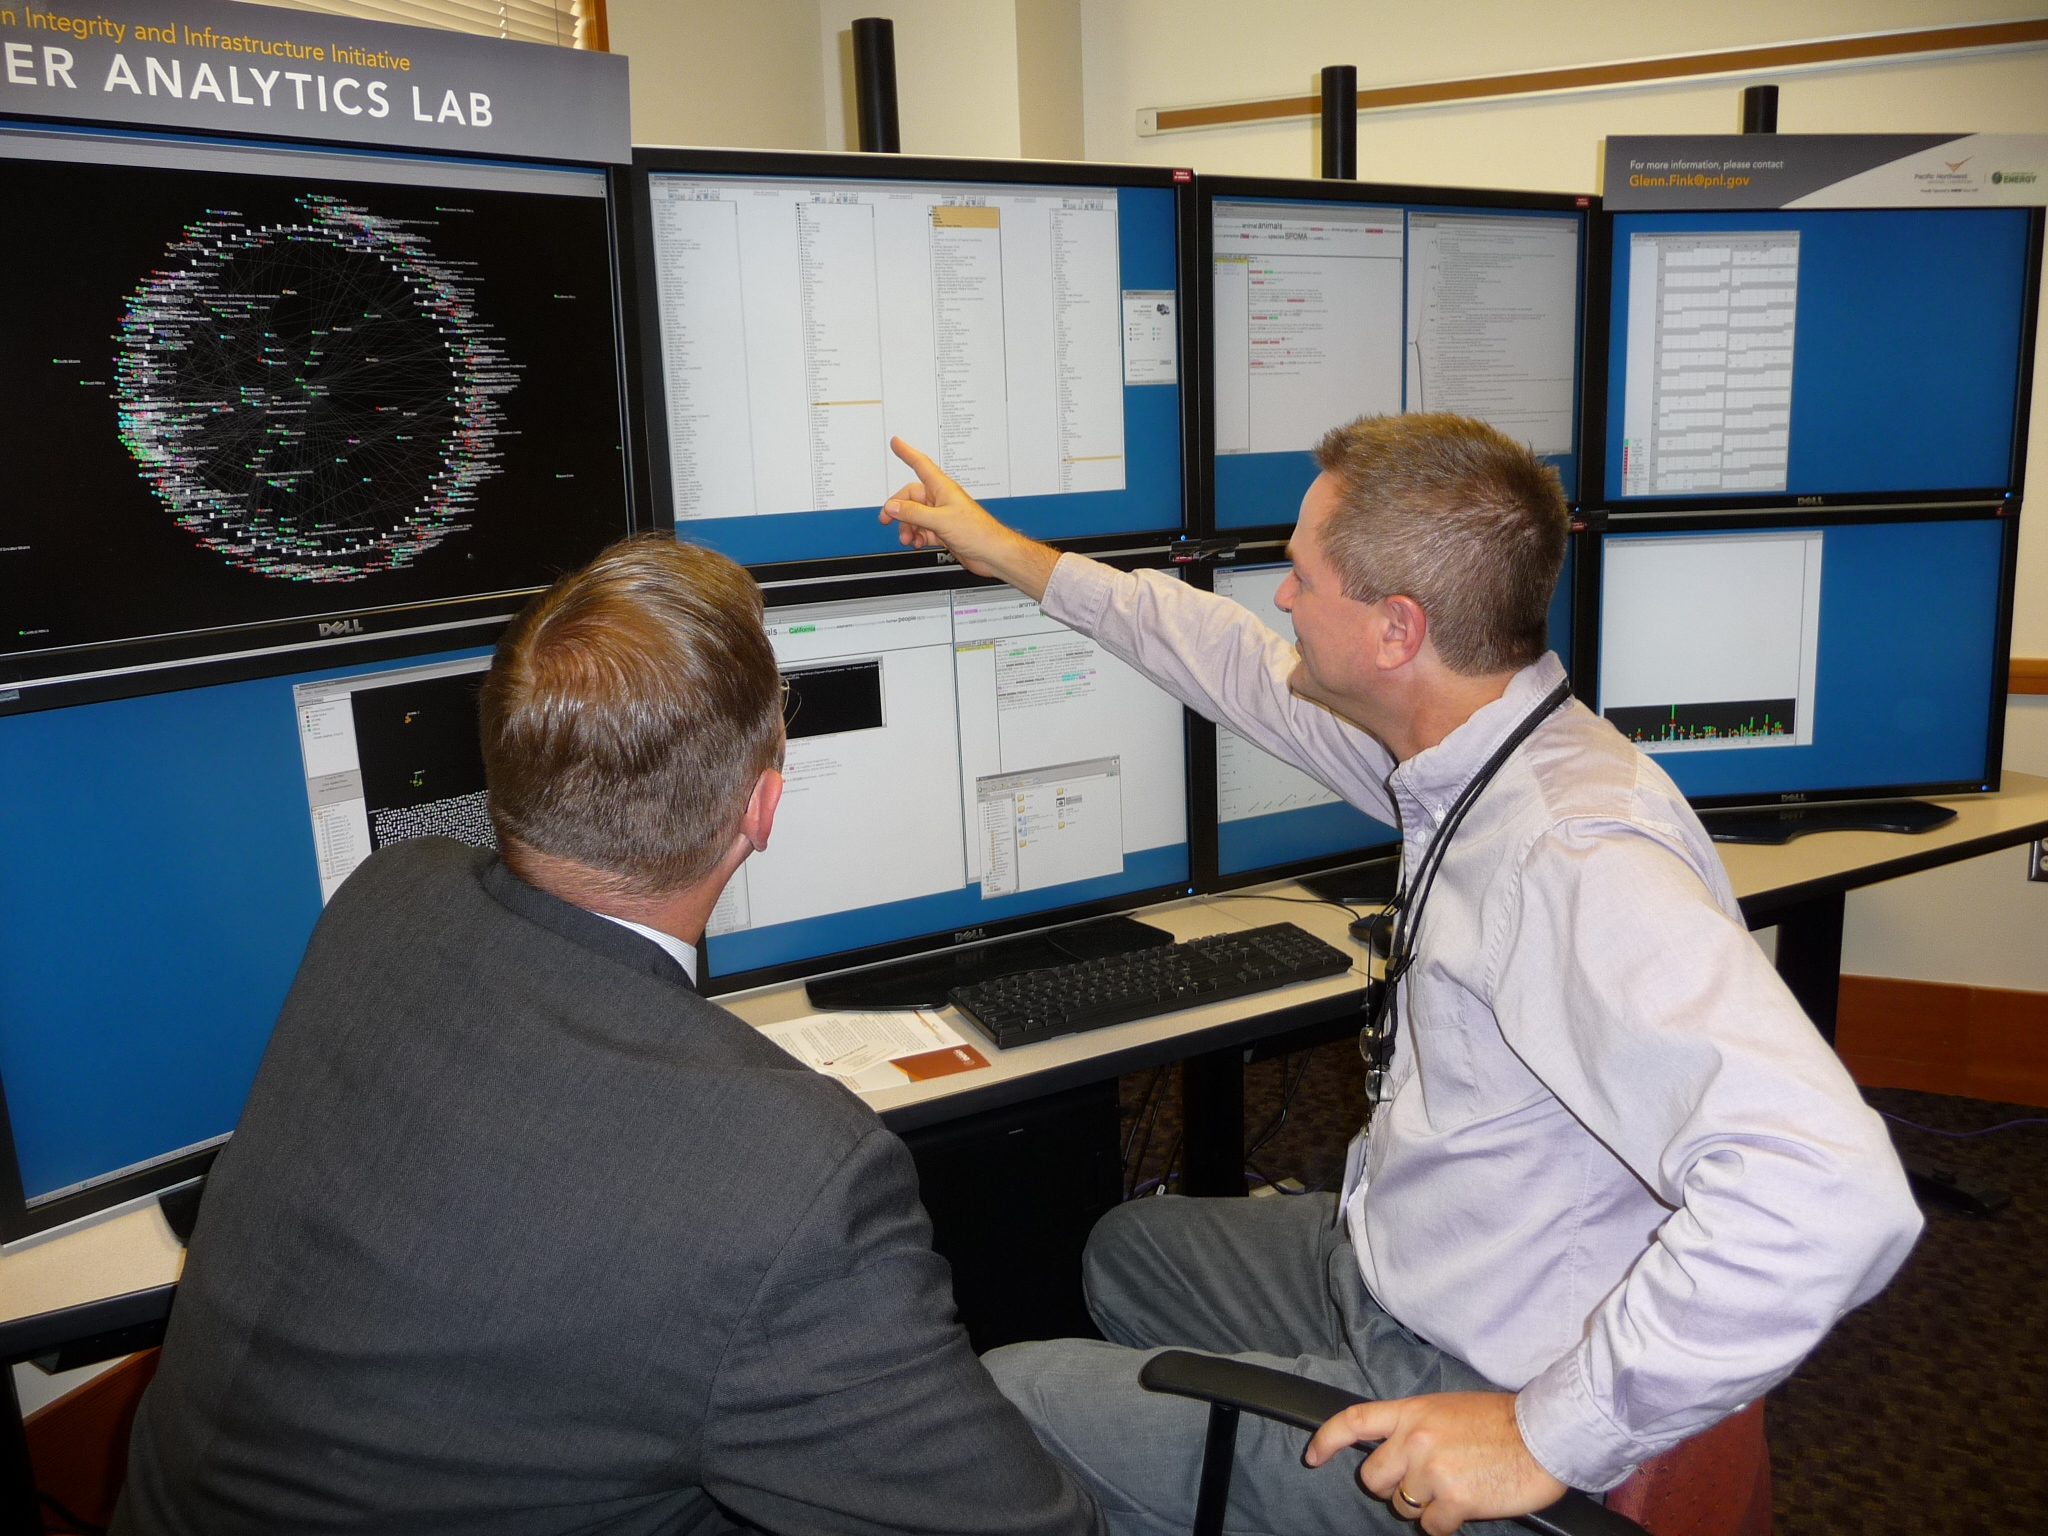
This research is supported in part by the VACCINE DHS Center of
Excellence and NSF Awards IIS-0915788 and CCF-0808863 (FODAVA Lead).
Past support for the project came from a grant from
the Dept. of Homeland Security's NVAC
Program and NSF Award IIS-0414667.
Last modified: January 20, 2014 |