Problems Using The Web
Notes:
- For this question, users were asked which of the following problems they
encountered when using the Web: not being able to find a page I know is out there
("find known info"), not being able to organize well the pages & information I gather
("organize"), not being able to find a page I once visited ("revisit"), it takes too
long to view/download pages ("speed"), not being able to visualize where I have been and
where I can go ("visualize"), and it costs too much ("cost"). Users were allowed to
mark more than one answer.
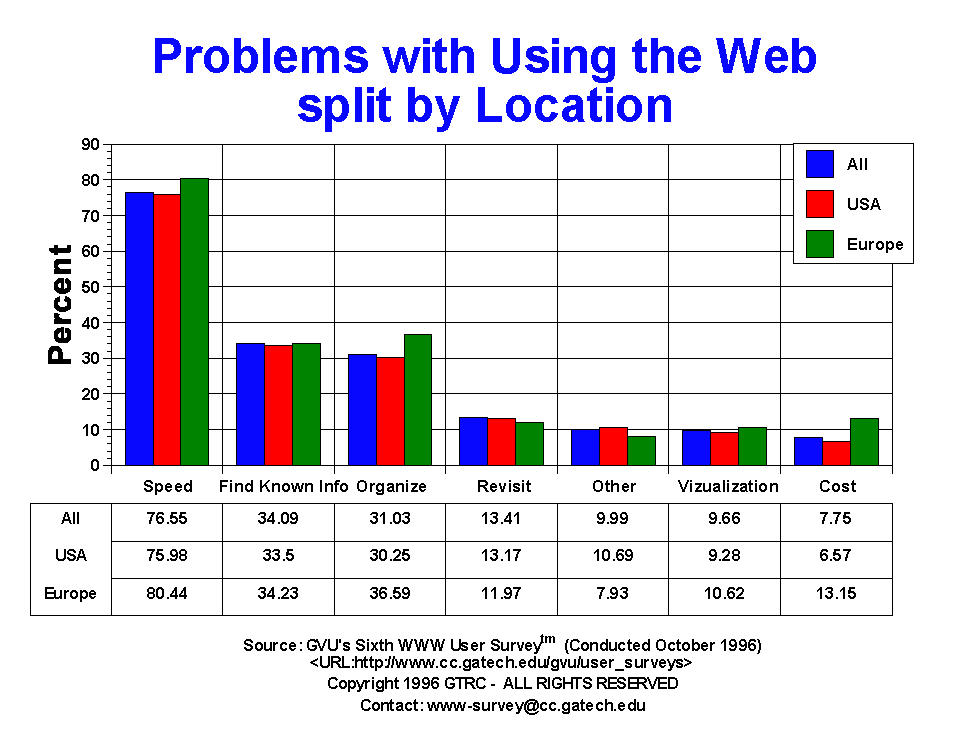
- Speed continues to be the number one problem of Web users (76.55%), and has been
since the Fourth Survey when the question was first introduced. This is not to say that the
problem has been getting worse, as the number who complained of speed is down from
80.9% in the Fifth Survey, but still higher than the 69.9% in the Fourth. This effect
is most likely due the the changes in connect speed of users to the Internet (See:
Connection Speed).
- The next big problems are "finding known info" (34.09%), organizing collected information
(31.03%), and being able to find pages already visited (13.41%). Cost does not seem
to be an issue, with only 7.75% reporting this as a problem. Given that the average
household income of Web users is well above the normal population, this is not very
surprising and cannot be taken to mean that the Web is currently affordable for all.
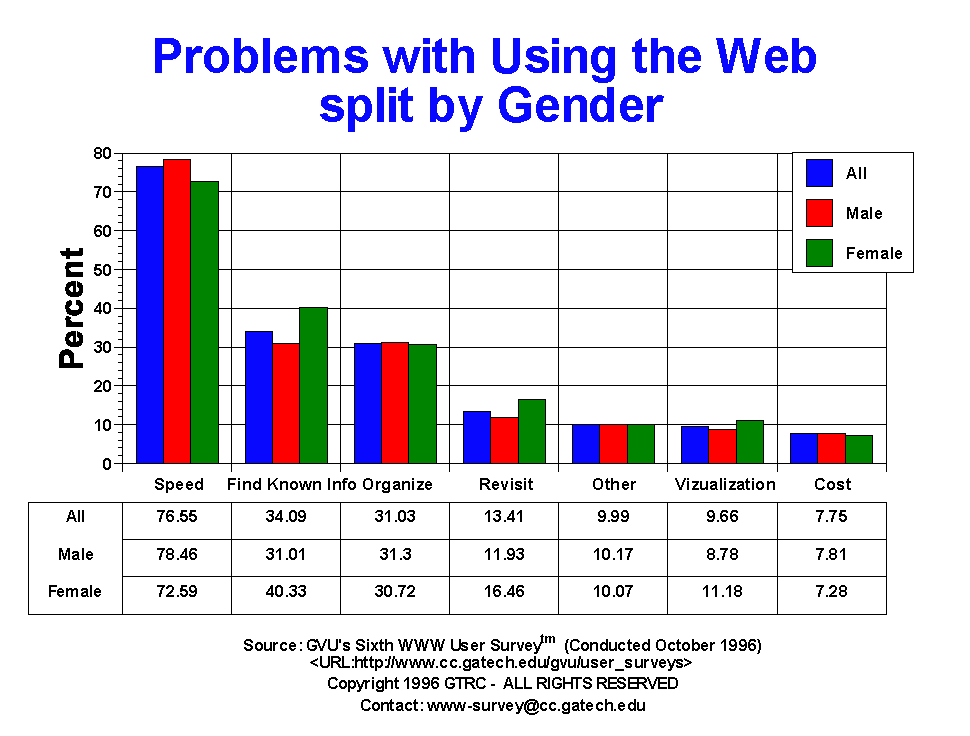
The only notable difference between genders was the problem of finding information: 31.01%
of males, and 40.33% of females reported this problem. This difference was found in the
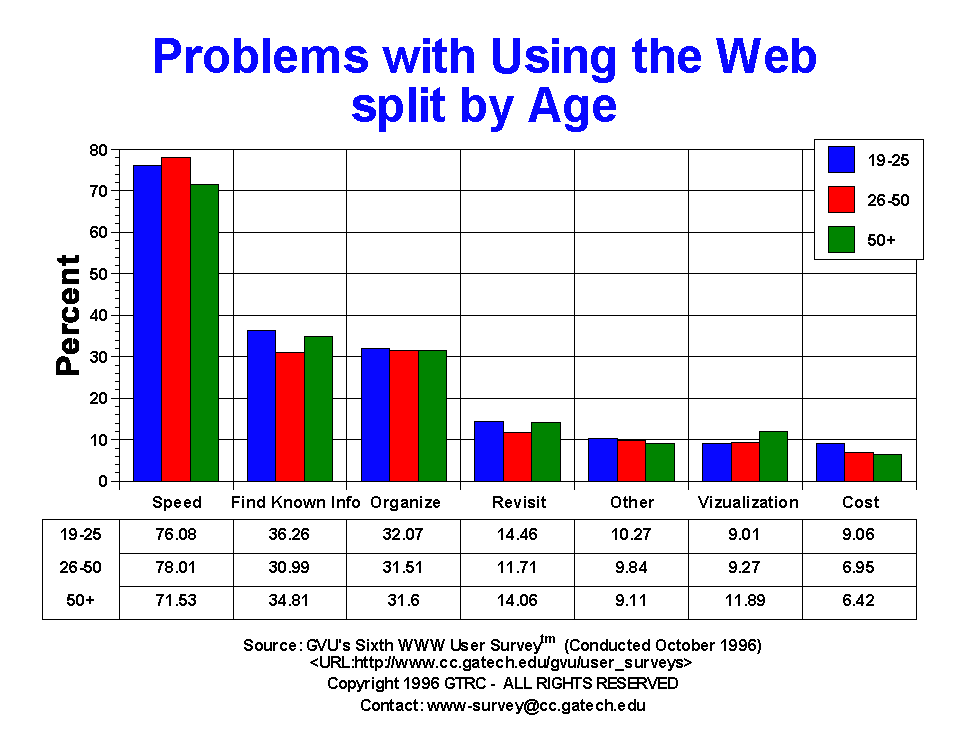
Fifth Survey as well. No major differences were reported across age groups.
Table of Data for All Categories
| Problems Using the Web |
All |
Male |
Female |
USA |
Europe |
19-25 |
26-50 |
50+ |
| Cost |
801.00 7.75% |
524.00 7.81% |
222.00 7.28% |
531.00 6.57% |
78.00 13.15% |
158.00 9.06% |
416.00 6.95% |
74.00 6.42% |
| Find Known Info |
3522.00 34.09% |
2080.00 31.01% |
1230.00 40.33% |
2709.00 33.50% |
203.00 34.23% |
632.00 36.26% |
1855.00 30.99% |
401.00 34.81% |
| Lost |
562.00 5.44% |
245.00 3.65% |
265.00 8.69% |
413.00 5.11% |
29.00 4.89% |
85.00 4.88% |
272.00 4.54% |
89.00 7.73% |
| Organize |
3206.00 31.03% |
2099.00 31.30% |
937.00 30.72% |
2446.00 30.25% |
217.00 36.59% |
559.00 32.07% |
1886.00 31.51% |
364.00 31.60% |
| Other |
1032.00 9.99% |
682.00 10.17% |
307.00 10.07% |
864.00 10.69% |
47.00 7.93% |
179.00 10.27% |
589.00 9.84% |
105.00 9.11% |
| Revisit |
1385.00 13.41% |
800.00 11.93% |
502.00 16.46% |
1065.00 13.17% |
71.00 11.97% |
252.00 14.46% |
701.00 11.71% |
162.00 14.06% |
| Speed |
7908.00 76.55% |
5262.00 78.46% |
2214.00 72.59% |
6144.00 75.98% |
477.00 80.44% |
1326.00 76.08% |
4669.00 78.01% |
824.00 71.53% |
| Visualization |
998.00 9.66% |
589.00 8.78% |
341.00 11.18% |
750.00 9.28% |
63.00 10.62% |
157.00 9.01% |
555.00 9.27% |
137.00 11.89% |


For more information or to submit comments:
send e-mail to www-survey@cc.gatech.edu.
GVU's WWW Surveying Team
Graphics, Visualization, & Usability Center
College of Computing
Georgia Institute of Technology
Atlanta, GA 30332-0280


