Problems Using the Web
Notes:
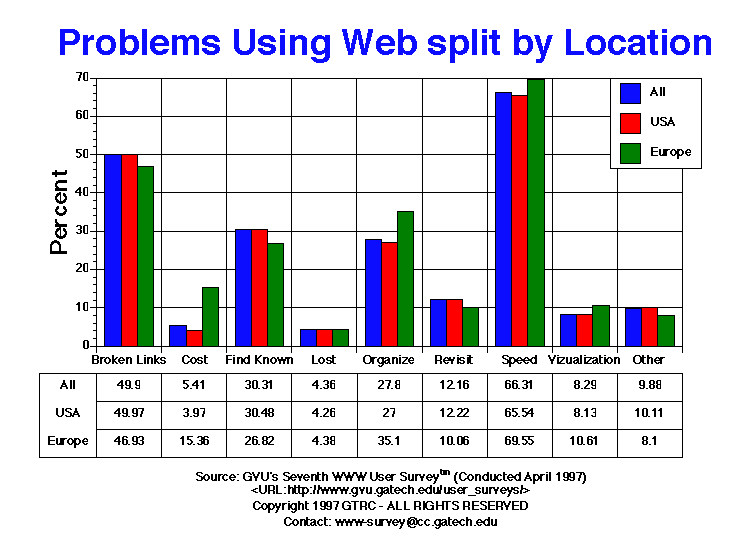
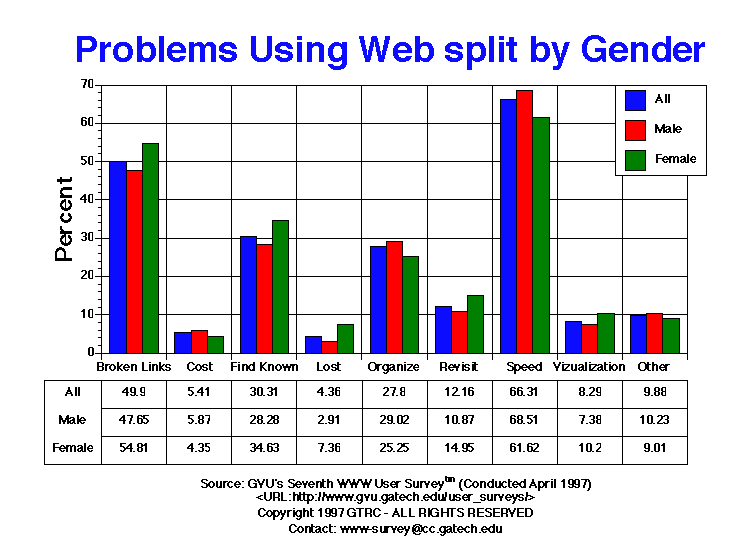
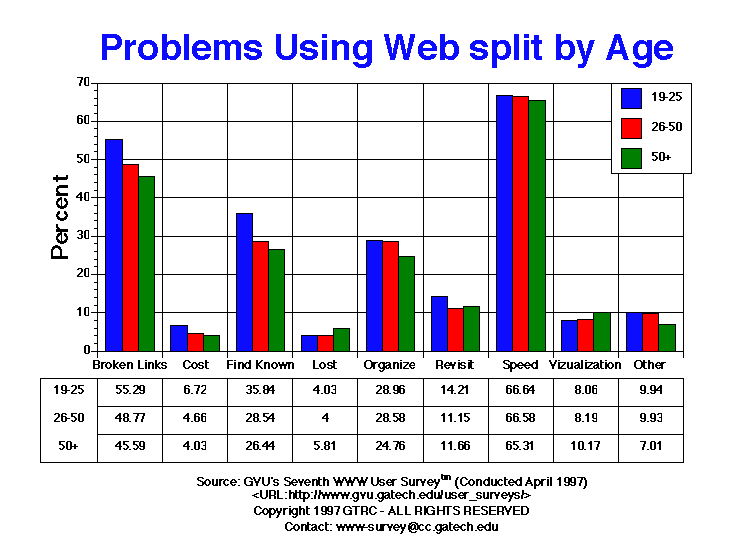
- For this question, users were asked which of the following are the biggest problems the Web (users could selected more than one response): links that don't work [linkrot] "broken links", not being able to find a page I know is out there ("find known info"), not being able to organize well the pages & information I gather ("organize"), not being able to find a page I once visited ("revisit"), it takes too long to view/download pages ("speed"), not being able to visualize where I have been and where I can go ("visualize"), and it costs too much ("cost"). Users were allowed to mark more than one answer. For the Seventh Survey, we added the "broken links" option.
- Speed continues to be the number one problem facing Web users, with 66.31% of the users reporting that it takes too long to download pages. However, this represents a 10% decrease from the Sixth Survey (76.55) and a 14% decrease from the Fifth Survey one year ago. This effect is most likely due the increases in connect speed of users to the Internet (See: Connection Speed). Almost half of the users report broken links as a big problem (49.90%), a situation with no immediate solution. The next big problems are "finding known info" (30.31% Seventh vs. 34.09% Sixth), organizing collected information (27.80% Seventh vs. 31.03% Sixth), and being able to find pages already visited (12.16% Seventh vs. 13.41% Sixth). Once again, cost does not seem to be an issue, with only 5.41% (7.75% Sixth) reporting this as a problem. Given that the average household income of Web users is well above the normal population, this is not very surprising and cannot be taken to mean that the Web is currently affordable for all. Males are more likely to complain about speed and organizing information while females are more likely to cite broken links and finding known information as the biggest problems.
Table of Data for All Categories
| Problems Using the Web |
All |
Male |
Female |
USA |
Europe |
19-25 |
26-50 |
50+ |
| Broken Links |
8136.00 49.90% |
5216.00 47.65% |
2809.00 54.81% |
6438.00 49.97% |
504.00 46.93% |
1646.00 55.29% |
4751.00 48.77% |
950.00 45.59% |
| Cost |
882.00 5.41% |
642.00 5.87% |
223.00 4.35% |
511.00 3.97% |
165.00 15.36% |
200.00 6.72% |
454.00 4.66% |
84.00 4.03% |
| Find Known Info |
4941.00 30.31% |
3095.00 28.28% |
1775.00 34.63% |
3927.00 30.48% |
288.00 26.82% |
1067.00 35.84% |
2780.00 28.54% |
551.00 26.44% |
| Lost |
711.00 4.36% |
318.00 2.91% |
377.00 7.36% |
549.00 4.26% |
47.00 4.38% |
120.00 4.03% |
390.00 4.00% |
121.00 5.81% |
| Organize |
4533.00 27.80% |
3177.00 29.02% |
1294.00 25.25% |
3479.00 27.00% |
377.00 35.10% |
862.00 28.96% |
2784.00 28.58% |
516.00 24.76% |
| Other |
1610.00 9.88% |
1120.00 10.23% |
462.00 9.01% |
1303.00 10.11% |
87.00 8.10% |
296.00 9.94% |
967.00 9.93% |
146.00 7.01% |
| Revisit |
1982.00 12.16% |
1190.00 10.87% |
766.00 14.95% |
1574.00 12.22% |
108.00 10.06% |
423.00 14.21% |
1086.00 11.15% |
243.00 11.66% |
| Speed |
10811.00 66.31% |
7499.00 68.51% |
3158.00 61.62% |
8444.00 65.54% |
747.00 69.55% |
1984.00 66.64% |
6486.00 66.58% |
1361.00 65.31% |
| Vizualization |
1351.00 8.29% |
808.00 7.38% |
523.00 10.20% |
1047.00 8.13% |
114.00 10.61% |
240.00 8.06% |
798.00 8.19% |
212.00 10.17% |


For more information or to submit comments:
send e-mail to www-survey@cc.gatech.edu.
GVU's WWW Surveying Team
Graphics, Visualization, & Usability Center
College of Computing
Georgia Institute of Technology
Atlanta, GA 30332-0280


