- Table 3-1 lists some of the modules grouped according to function.
- Table 2-1 through Table 2-3 in Chapter 2 list some of the the modules according to the kind of data they accept and deliver; for example, lattice or geometry data.
- The IRIS Explorer Reference Pages list all modules alphabetically and set out the specifications of each one.
Not all the modules listed are available on all systems. The IRIS Explorer Reference Pages indicates the modules available for general distribution.
A selection of modules is listed by function in Table 3-1. (footnote)
| Module Function | Module Names |
|---|---|
| Read data in or create it from scratch | ComposePyr, GenerateColormap, GenLat, MopacView, Read2Da, ReadAudio, ReadAVS, ReadAVSfld, ReadAVSimage, ReadAVSucd, ReadAVSvol, ReadGeom, ReadHDF, ReadImages, ReadImg, ReadLat, ReadMovieBYU, ReadNTF, ReadPDB, ReadPhoenics, ReadPyr, WaveFormColormap |
| Process images | AbsImg, AddImg, AndImg, BlendAlphaImg, BlendImg, BlurImg, CompassAngleImg, CompassDirImg, CompassImg, ComplementImg, DivImg, ExpImg, ForwardFFTImg, FourierConjgImg, FourierCrossCorrImg, FourierDivImg, FourierExpFltImg, FourierGaussFltImg, FourierMagnitudeImg, FourierMergeImg, FourierMultImg, FourierPhaseImg, FourierPwrImg, GaussBlurImg, GrayScaleImg, HistEqualImg, HistNormImg, HistScaleImg, InverseFFTImg, LaplaceEdgeImg, LogImg, MaxFltImg, MaxImg, MedianFltImg, MinFltImg, MinImg, MultImg, NegImg, OrImg, PowerImg, PseudoColorImg, RankFltImg, RobertsEdgeImg, RotZoomImg, SGIPaletteImg, SharpenImg, SobelEdgeImg, SqRootImg, SquareImg, SubtractImg, ThreshImg, XorImg |
| Generate data from other data | AtomicSurf, ChannelSelect, ClipPyr, CropPyr, DiffLat, DisplaceLat, Gradient, Gradient3D, Interpolate, LatFunction, LatToPyr, MagnitudeLat, MinMax, Mixer, MultiChannelSelect, MultiSlice, OrthoSlice, OutLine, ProbeLat, PyrToLat, Ruler, SampleCrop, SamplePyr, ShrinkPyr, ScaleLatNode, Shell, Slice, SubSample, TriangulateDelauney, Triangulate3D |
| Develop geometric representations | Annotation, Ball, BallStick, BoundBox, BoundBoxPyr, Contour, GnuPlot, Graph3D, IsosurfaceLat, IsosurfacePyr, LatToGeom, Legend, MoleculeBuilder, MultiSlice, NAGAdvectSimple, QueryLat, PyrToGeom, SliceLat, SlicePyr, Streakline, VectorGen, Vectors, VolumeToGeom, WireFrame |
| Create images | DisplayImg, Histogram, Graph, RealityRender, Render, RenderRemote, TransformGen |
| Multimedia (audio and video) | AnimateCamera, AudioIn, AudioOut, ReadAudio, VideoControl, VideoDevice, VideoLabInWin, VideoStarterIn, VideoStarterInWin, VideoStarterOut, WriteAnimation, WriteAudio |
| Control looping sequences | AnimateCamera, For, Repeat, Render, Trigger, While |
| Miscellaneous | CompressPyr, DiffLat, ExpandPyr, NAGContour, NAGGraph, SwitchGeom, Timer, Trigger |
| Write data to disk | PrintLat, PrintPick, PrintPyr, WriteGeom, WriteImg, WriteLat, WritePyr |
Creating Colormaps
When you are looking at large amounts of data, it helps to be able to distinguish significant features easily, and a convenient way to differentiate a range of values is by using color. The GenerateColormap module control panel (see Figure 3-1) lets you select a color space, manipulate the color bands, and send the results to Render, where the visualized data object is colored according to its data values.
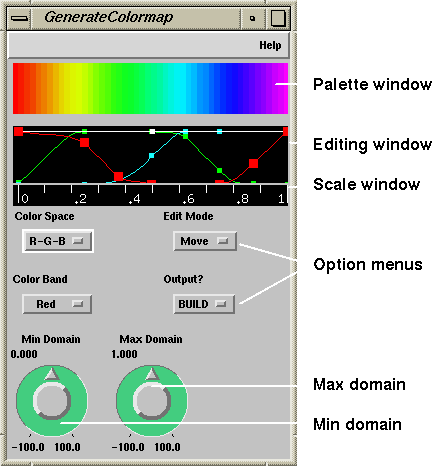
Figure 3-1 The GenerateColormap Module
GenerateColormap has two input ports, both of which accept the lattice data type, and several input parameters that are connected to widgets on the module control panel. The first input port accepts a colormap, which means you can read a colormap data file that contains preset parameters into the map. The volume map in Chapter 1 provides an example.
The second input port accepts data in the form of a lattice, which means you can feed a lattice into the colormap to set the minimum and maximum limits of the domain. Both these ports are optional.
The output port produces a colormap in the form of a 1D lattice. You can
connect
GenerateColormap
to any module that has a
Colormap
input port. These include
BallStick,
Contour,
LatToGeom,
PyrToGeom, and
VolumeToGeom.
You can have several
GenerateColormap
modules in a map if your X server contains enough entries in its colormap
table. See
Running the X Server
in Appendix
A for more information.
You change the slope, and hence the value, of a color band in order to
adjust the color spectrum in the colormap. In this fashion, you can emphasize
certain subsets of your data and block out others. This is easiest to do with
the full-scale
GenerateColormap
control panel (see
Figure
3-1).
The control panel has three windows:
Use the
Output?
option menu to select a mode in which to work. The
Build
option disables the module temporarily while you edit the color bands. This
is useful if you want to experiment without the module constantly firing and
sending data to the modules downstream.
The
Run
option re-enables the module. All changes are reflected in the color palette
as you make them, and are simultaneously sent to the next module downstream.
Each map processes data with values over a specified range. You can set
the limits of the range affected by
GenerateColormap
by turning the
Min Domain
and
Max Domain
dials. Each dial has two text slots that you can use to define the range for
minimum values and maximum values.
To change a domain value (min, max, or current), click on the text slot to
highlight it and type in the new value, then press
<
Enter>. The new value appears in the text slot and in the
scale window.
You can edit only one color band at a time. To select a color band:
All four bands appear in the editing window. In the HSV color space, the
bands might be superimposed on one another, therefore more difficult to see.
The active band is named on the option menu button and stands out in the
editing window because the control points, shown as square boxes along the
band, are enlarged.
You edit color bands by adding control points at intervals along their
length and then dragging the points around in the editing window. The points
appear as filled boxes (see
Figure
3-2).
Use the
Edit Mode
option menu to add and remove control points. The
Insert
and
Delete
options default to
Move
after every insertion or deletion of a point.
To add a new control point to a color band, select
Insert
from the
Edit Mode
option menu and click on the color band at the place where you want the new
point. The point is centered between the existing points on that segment of
the color band. Move it by dragging on it.
The closer together the points are, the more precise the changes that you
can make to the shape of the curve. However, you cannot move a point past the
one to its left or right.
To remove an existing control point from a color band, select
Delete
from the
Edit Mode
option menu and click on that control point.
You can delete any point except the endpoints.
Each control point (except the end-points) has two empty squares
associated with it, which control the slope of the curve at a given point.
They are the derivatives of the curve at that point.
When you select a control point by clicking on it, the slope control
points appear on either side (see
Figure
3-3). They disappear when you select another point.
If you want to sharpen the curve toward the lower boundary of the window
and the position of the slope control point blocks you, simply add another
point to the line near the first point and use its derivatives to alter the
slope.
GenerateColormap
creates a rainbow-like colormap when you first launch it. You can use a
different colormap as your starting point if you wish.
To read in a custom colormap, first launch a
ReadLat
module and connect it to the input port of
GenerateColormap.
Then use the file browser in
ReadLat
to read in the colormap file. The
GenerateColormap
module will approximate the input colormap as closely as it can. You can use
control points to edit the color curves that it creates.
IRIS Explorer has another module,
WaveFormColormap, which uses ramp waves of variable frequency, rather
than direct manipulation, to establish a relationship between data values and
colors. For more information, refer to
WaveFormColormap
in the
IRIS Explorer Reference Pages.
A colormap is a lattice with a specific format: it is a 1D, 4 vector,
float uniform lattice with 2 to 256 components. You can create such a lattice
by saving a map produced by
GenerateColormap
or
WaveFormColormap, or by any other module or program that can produce a
lattice in this format.
You can save a colormap to disk by connecting a
WriteLat
module to
GenerateColormap's output port. Then use the file browser to give the
saved colormap a filename.
This example illustrates how to generate a colormap for a lattice and
alter the relationship between the data values and the color spectrum.
GenLat,
LatToGeom,
Render, and
GenerateColormap
GenLat
to
LatToGeom
(Output -- Lattice to Input -- Lattice)
GenLat
to
GenerateColormap
(Output -- Lattice to Data In -- Lattice (Opt))
GenerateColormap
to
LatToGeom
(Colormap -- Lattice to Colormap -- Lattice (Opt))
LatToGeom
to
Render
(Output -- Geometry to Input -- Geometry (Opt))
Click on the
Output?
option menu and select
Run. Then do the following and look at the results:
The
GenLat
module (see
Figure
3-5) enables you to generate synthetic lattice data for test maps. You
can create a large variety of lattices of different sizes, shapes, contents,
and representations in order to drive other modules that accept lattices. For
example, you can easily verify that a given module performs properly on any
type of input lattice. Simply connect
GenLat
to the module, and then start generating different types and styles of
lattices.
GenLat
has no input ports and only one output port for the generated lattice. You
can connect it to any module that accepts the type of lattice you want to
generate.
GenLat
creates a single lattice each time it fires. You can control the shape and
contents of this lattice by manipulating the widgets on the control panel.
Two of the most important parameters of a lattice are its size and
dimensionality. If you increase these values,
GenLat
creates larger lattices, a process which takes commensurately more time.
Depending on the Domain selected GenLat
creates lattices with the same number of elements on each side
(square domain, e.g. 8x8x8 in 3D and 25x25 in 2D), or lattices
that may have a
different number of elements on each side (non-square domain, e.g.
8x6x3 in 3D and 20x25 in 2D). When non-square lattices are
selected, additional
widgets are visible on the module control panel
(J Size and K Size).
To alter these values, move the
Dimensions
and
Size (J Size, K Size)
sliders at the bottom of the control panel. You can also type new values
into the slider value areas to get an exact value.
Another way to generate test lattices that do not have the same number of elements on
each side, is by combining
GenLat
with a module such as
SampleCrop.
To set the visual shape of a lattice, click on the
Coord Type
option menu and select an option.
To set the coordinate representation for a lattice, click on the
Coord Representation
option menu and select an option.
You can generate a curvilinear lattice with coordinates that are uniform
in computational space. This option is useful for testing modules which
require such lattices on their input ports.
Certain combinations of coordinate representation and coordinate style do
not make sense, though, because only curvilinear representation can be used
to store the position information for the torus and related coordinates.
The data values in lattices can be any of the primitive data types
(see Using the Lattice Data Type
in Chapter 3 of the IRIS
Explorer Module Writer's
Guide). These include byte, short, long, float, and
double.
To set a data type, click on the
Data Type
option menu and select an option.
Data values are scaled either in a fixed range of zero to 255 or their
maximum possible range for the integer types (char, short, or long). However,
a range of -1.0 to 1.0 is used for float and double.
To set the data range, click on the
Coord Range
option menu and select an option.
Using the maximum possible range for the long primitive type can generate
very large numbers.
The values of the data can be generated by one of several functions. The
default is
sines,
which fills the data space with the product of sine functions evaluated over
a certain number of cycles in each dimension. The other functions are:
DataVec Length
indicates the number of components at each node of the lattice.
To display lattice data in IRIS Explorer, you can:
Since
Render
accepts only Geometry data, you must wire modules that produce lattice or
pyramid data to
LatToGeom,
VolumeToGeom, or
PyrToGeom, which in turn can be connected to
Render. You can also send a lattice directly to
DisplayImg.
Figure
3-4
shows a lattice passed directly to
LatToGeom.
A useful way to examine data is to make a 2D cut through a 3D volume, that
is, to slice the volume and look at the data in that slice.
There are several ways to do this, depending on the type of data you start
with and the results you want to produce.
Table
3-2
shows which slicers you can use for each combination of lattice types.
You can use the DataScribe to create a single module which combines
all these functions. See
Chapter
7
for more information.
You can also use other modules such as CropLat2D and CropLat3D, to
view slices of a lattice. See the IRIS Explorer Reference
Pages for more information on these modules.
OrthoSlice
cuts along the
i,
j, and
k
axes in computational space. For a uniform or perimeter lattice, these
correspond to the
x,
y, and
z
physical axes. Curvilinear lattices have a more complicated relationship
between computational and physical space.
The slice number corresponds to the node number. The slice is taken along
the axial plane at that particular node. Selecting slice i
corresponds to cutting a slice at node i-1.
Figure 3-7 shows a map that uses
OrthoSlice to display part of a lattice. You can use any
lattice data. For example, you can replace GenLat with
ReadLat and read in an external lattice data file if you
wish. A good choice is
/usr/explorer/data/lattice/testVol.lat. You can also color
the output with a colormap by wiring GenerateColormap to
OrthoSlice.
The modules in Figure 3-7 are GenLat,
OrthoSlice, LatToGeom, and Render. The slice is
taken along the i axis of a half-cylinder.
It takes slices from a curvilinear lattice in the form of:
The module accepts a transform from
TransformGen
which sets the orientation of the slice. The slice is output in the form of a
pyramid.
You can select the form the probe takes (Probe Type) and the area of the
slicing plane (Clip Size) from the
ProbeLat
control panel.
For pyramids you can use
SlicePyr
and
ClipPyr.
Figure
3-13
shows a paddlewheel probe generated by ProbeLat.
You can examine data distribution in a lattice by connecting any module that
has a lattice output into the
Histogram
module and generating one or more histograms. The histogram (see
Figure
3-14) shows how many times a data value occurs in the input lattice.
The
Histogram
module has one lattice input port and one lattice output port. The input
port accepts any type of input lattice, and the output port produces a count
of the input data values in the form of a lattice.
The
Histogram
control panel has a display window that shows the histogram itself and scale
windows that show the domain (horizontal, or
x, axis) and range (vertical, or
y, axis) of the data values.
The domain changes automatically according to the channel selected. You
can override the default limits by entering new values in the
Min Domain
and
Max Domain
text slots on the control panel.
The
Histogram
module divides the range of data values in the lattice into a number of equal
subranges called
buckets.
It counts the number of nodes in the lattice whose values lie in each of the
buckets and produces a histogram of the counts.
To set the number of subdivisions in the data domain, you can move the
Num of Buckets
slider, or type in a new value and press
<Enter>.
If you define a domain with a narrower spread of values than the actual
dataset in a channel, then the out-of-range values are omitted from the
histogram if
Outliers
is set to
Omit; all the data points below the minimum value on the scale
are put into the first bucket, and all the data points above the maximum are
put into the last bucket if
Add
is specified.
The range of data counts is indicated by the height of each bucket.
The option menus let you choose whether you want to generate a histogram
for only one data channel of the input lattice, or for all channels. Each
channel shows the values for one variable in the input lattice.
To select a data channel, move the
Channel
slider (this slider is displayed only if more than one channel may be
selected from the input lattice). You can also type a number into the Current
Value slot at the top of the slider.
To choose between displaying one channel or all channels, click the
relevant radio button.
If you select
One Channel, a single histogram showing the data distribution in
the selected channel is displayed.
If you select
All Channels, you see as many separate but overlapping
histograms as you have channels. The active histogram is white. It shows the
currently selected channel, which is the channel corresponding to the number
on the slider. You can change the active histogram by using the slider to
select another channel (while in the
One Channel
mode).
When you select
One Channel
or
All Channels,
Histogram
produces a 1D output lattice.
When you select
Multi-Dimensional, you do not get a display, and the output
lattice has a different format. The number of data variables in the input
lattice defines the number of dimensions of the output lattice. For example,
if the input lattice has three data variables, the output lattice will be 3D.
Each side of the output lattice is divided evenly into the number of
buckets defined for the input lattice. The data buckets are formed by
dividing the 3D lattice into smaller cubes, each of which contains the data
points in that section of the total volume.
This example illustrates how you can generate a histogram for each data
channel of
GenerateColormap
using
Histogram.
When
GenerateColormap
passes data to
Histogram, you can create a histogram for the data coming in from a
single channel, or for the data coming in from all four of
GenerateColormap's channels.
At times, you may find it useful to display an image, as opposed to a
geometric object, on the screen, perhaps to see what the original image data
looks like before it is processed through a map, or so that you can compare
two images, or create a composite image from two separate images.
The
DisplayImg
module (see
Figure
3-15) accepts image data in the form of a 2D lattice, either black and
white or in color.
You can display several images in the
DisplayImg
window at any given time. Simply wire as many modules as you require into the
input port of
DisplayImg.
As each module upstream from
DisplayImg
fires, an image appears in the
DisplayImg
window. The image is placed at the bottom left-hand corner of the window, and
each subsequent image is stacked on top of it.
You can
photograph
the image in the window and send it on to another module to be processed by
clicking on the
Snap?
button. You can arrange several images in the window and
Snap?
will produce a single composite image that is the same size and shape as the
original.
You can also remap the image.
The
DisplayImg
window should not be obscured by any other windows, or the image will not be
properly displayed.
Because the product of
DisplayImg
is also a lattice, you can send the image to any module that accepts a 2D
lattice, through the lattice output port on
DisplayImg.
This example illustrates the use of
DisplayImg
to compare an image in its original form with the same image after it has
been modified.
When the module fires, you should have two copies of the image in the
DisplayImg
window. Use the mouse to position them in the full-scale module window.
Since IRIS Explorer visualizes numerical data after it has been processed
in various ways, the
Render
module (see
Figure
3-17) is naturally a very important part of the process. It is
Render
that:
The
Render
module can accept multiple inputs, and it manages each one separately. Its
viewing and editing functions are available only in the full-scale control
panel. When the full-scale window is open, the Diminutif window is blanked.
Render
has several viewing modes and an edit mode, in which an object can be
selected and its attributes altered. The functions and attributes of the
Render
module are described fully in the
IRIS Explorer Reference Pages.
Before you can display an object in the
Render
window, you must wire
Render
into a map that generates the object.
Render
has six input ports: four of them accept geometry inputs and two accept
lattices.
The most frequently used input port is the
Input - - Geometry
port, which accepts the geometry necessary to create an object or scene from
any module with a geometry output port.
The
Annotation - - Geometry
port accepts text labels for parts of the geometry in the
Render
window. Its use is illustrated in the
pick
map in the Module Librarian.
Render
has four output ports. The
Pick - - Pick
port outputs pick data to a picking module. The other ports let you take
snapshots of the object in the
Render
window and export them to other modules and provide synchronisation
for loops. This is useful for making animations.
Render
has four mutually exclusive viewing modes. The viewing mode is a way of
considering how the camera in the scene is moving. The viewing modes are
selected from the
Edit
menu on
Render's menu bar. Each one lets you view the scene in the
Render
window in a slightly different way. You can
examine,
fly
by, or
walk
by the object, or you can change the viewing
plane.
You can zoom in and out, as if looking at the object through a telephoto
or wide-angle lens. The object appears closer when you zoom in, although it
actually remains the same distance from the camera.
To zoom in or out, hold down the left and middle mouse buttons and move
the mouse towards or away from the screen.
Render
has two picking modes, viewing or picking/selecting an object. In the
Pick/Edit
or view mode, you can change the camera parameters, that is, the position,
direction, and field of view of the camera in relation to the object.
In the
User Pick Mode, you use the mouse and buttons to select objects,
attach manipulators, and query objects through picking.
To select an object, click the left mouse button on it. The object appears
surrounded by a red box (see
Figure
3-18).
You can view an object in the
Render
window from a different position by manipulating it using the left or middle
mouse button in
Examiner
viewing mode. These actions change the camera position from which you are
looking at the object.
To roll the camera, that is, to rotate it on an axis perpendicular, or
normal, to the screen, hold the left mouse button down and drag the object,
either clockwise or counterclockwise. The object spins in the direction in
which you dragged it. The object rotates faster according to the speed with
which you push or drag it. It continues to rotate once you release the mouse
button. To stop it, click on the mouse button outside the object.
To move the camera view around the center point, that is, to move it in
the plane of the screen, hold the middle mouse button down and drag the
object.
The
Render
pop-up menu (see
Figure
3-19) appears when you click on the background of the
Render
window. If you zoom or truck in too far and lose sight of the object, click
on the window background with the right mouse button and select
View All
from the
Functions
submenu of the pop-up menu.
You can also select the
Draw Style
(for example
wireframe), switch
Headlight
and
Decoration
on and off and set some
Preferences
for display. The
single buffer,
double buffer, and
interactive buffer
options on the
Draw Style
submenu of the pop-up menu refer to the type of buffering you are using.
The
Render
module provides several graphical shortcuts for manipulating objects in the
Examiner, Navigator, and edit modes. To use the shortcuts, select
Decoration
from the pop-up menu. A frame containing several widgets appears around the
Render
window (see
Figure
3-20).
The widgets include:
When you have an opaque object in the
Render
window, it may be easier to examine or move around in wireframe form. You can
draw the object as a wireframe structure (see
Figure
3-21) by selecting
Draw Style
from the
Render
pop-up menu in either viewing mode, then clicking on
wireframe.
This command acts on all the objects in the scene, not just on a selected
object.
If you are viewing a complex scene with several objects, it may take a
long time to render each frame while moving it. Wireframe rendering is much
faster than rendering opaque objects, so you may want the objects to be
rendered in wireframe while they are moving and opaque when still.
To draw the objects in wireframe as the camera moves, use the
move wireframe
option. When you release the mouse button, the objects are again drawn in
their original mode.
Objects displayed in
Render
have a variety of attributes. They include positional properties, such as
translation, rotation, and scale, and surface properties, such as color,
specularity, and transparency. You can change or edit all these attributes
using the
Render
editors in User Pick Mode.
You edit object attributes by picking the object and then selecting an
editor from the
Editors
menu.
Each editor provides access to various attributes of the object (see
Table
3-3).
The Material Editor (see
Figure
3-22) lets you change the color and texture of an object in a scene. You
can set:
Use the sliders to set the brightness, or intensity, of each color.
To change the material color itself, click on one of the radio buttons on
the Editor. The Color Picker appears and you can edit the ambient, diffuse
(usually the same as ambient), specular, and emissive colors in turn. By
clicking on the square buttons to the right of the radio buttons, you can
select to edit one or more of these colors simultaneously. In this case, a
tick mark appears to indicate which colors have been selected for editing.
Naturally, in this situation they will all have the same color assigned to
them.
For details on how the Color Picker works, refer to
Using the Color Editor
below.
You can change the color properties of the object material using the
Color Editor (see
Figure
3-23). Use the
Sliders
menu to select
RGB,
HSV, or both. Choose colors from the color wheel. Use the
Edit
menu to stipulate whether or not the change is immediately reflected in the
object. By selecting
Manual, you can prevent any color change taking effect on the
object until you are ready.
Use the two color squares to test new colors and store the previous one.
By clicking on the three arrowed pads beneath the squares, you can switch
back and forth between colors.
The new color is always on the left and the previous color on the right.
You can send the new color to the right square, or the old color to the left
square.
The Color Pickers in the other editors work in the same way as the Color
Editor, although they affect the color of different items.
The Transform sliders (see
Figure
3-24) let you rotate, translate, and resize any object that is part of
the scene in the
Render
window. The changes affect only the selected object, not all the objects in
the scene. The slider widgets are:
When you click on a the title of a slider, for example,
TRANSLATIONS, the slider opens up and shows three text slots, one
each for the
x,
y, and
z
coordinates. Enter the new value and see how the position of the object
changes.
Next to the slider name in the open slider is a
Style
button. It offers three different layout styles for the widgets in the
slider. To see the different widget layouts, click on
Style.
If you want to make an object transparent, use the
Transp
slider in the
Material Editor
(see
Using the Material
Editor). To display the transparent object, you can select
Screen Door Transparancy
or any of the other sorted transparency widgets on the
Viewing
menu.
Some workstations do not support sorted transparency. They can only display
transparent objects in
Screen Door
format.
As its name implies, Screen Door Transparency renders objects as meshes
that you can see through.
Sorted transparency, also called blended transparency, gives a more
accurate rendering of the transparent object, but the scene is drawn more
slowly than in Screen Door format.
The
Render
module has a headlight that is situated in the camera position, which is
defined as being just over your left shoulder. The headlight moves with the
camera. You can also create point, spot, and directional lights, which remain
with the objects in the scene. Thus, if the camera moves left, the lights
appear to move to the right. You can have as many as you like on at any given
time.
You can change the direction, color, and intensity of each light in the
scene by using the
Lights
menu to toggle lights on and off and to edit their attributes. You can also
edit ambient light levels.
If you cannot see the
Lights
menu on the
Render
menu bar, just enlarge the
Render
window to the right.
Changes to the lights affect all the objects in the scene, unlike changes
to the transform and material properties, which apply only to the selected
object.
To edit the properties of a light, for example, the headlight, select
Headlight
from the
Lights
menu and click on
Edit. The Edit window appears (see
Figure
3-25), displaying the light you have selected.
You can also adjust the angle at which the light shines on the object by
clicking on the directional arrow and changing its position in the window.
The
Edit
menu provides access to the Color Picker window for changing the color of
the light. The Color Picker works in the same way as the Color Editor.
The
Manips
menu options let you rotate and translate objects in a scene by attaching
one of several manipulators to them. You can use only one type of manipulator
at a time, but you can attach it to each of several objects at the same time.
You can use these manipulators to reposition the object in the scene. The
movement is not as precise as that achieved by using the sliders in the
Transform Editor, but it is a more direct manipulation.
To remove a manipulator from an object, click on
None (this will surround the object by a red box to
indicate it is selected)
or select another manipulator from the
Manips
menu. Click on the background of the Render window to remove
a manipulator completely.
The
Trackball
manipulator (see
Figure
3-26) consists of opaque stripes surrounding the object. These stripes
are aligned with the local axes of the object.
If you start the trackball spinning and then move the mouse outside the
sphere, the ball continues to spin within the plane of the screen.
You can use the
Transform Editor
to monitor the object's degree of rotation, as reflected in the rotation
slider values.
You may sometimes need to go beyond the linear dataflow model of existing
IRIS Explorer maps to build maps containing dataflow loops. They are needed,
for example, for data interrogation through picking in
Render, iteration through data sets using
For
or a multiple-data set reader, and convergence of a simulation using
While.
For example,
Figure
3-27
illustrates a loop from
Render
to
QueryLat
and back to
Render.
The user picks on an object in
Render, which fires and sends the pick coordinates to
QueryLat.
QueryLat
turns the coordinates into text and sends it to
Render. When the data arrives back at
Render, the loop is terminated. To start the loop again, the user has
to make another pick.
The common goal in all loops is to feed data from one phase of an IRIS
Explorer computation back around to the next phase of the computation. As in
most programming languages, loops in IRIS Explorer are a basic and necessary
semantic element. It is also true that looped maps are more complex than
linear, or unlooped, maps. This section describes how you can conveniently
and correctly employ looped maps in your IRIS Explorer data visualizations.
You can create two kinds of loops, While loops and Repeat loops, like the
similarly named loops in C. In While loops, a specific condition evaluates to
true
and then an iteration takes place. This sequence is repeated until the
condition evaluates to
false.
In Repeat loops, an iteration takes place and a condition is then
evaluated. Similarly, the sequence is reiterated until a stopping condition
is reached.
Loop controllers are identified in the Map Editor by a small square
icon, the controller icon, at the centre of the title bar in the mini
and micro control panel (see Figure 3-28).
You can identify a loop controller module only after it has been
launched in the Map Editor; until then, it is indistinguishable from
other modules in the Module Librarian.
You can also look at the .mres file in the Module
Builder; the Build Options window indicates whether the module is a
While or Repeat loop controller, or neither. For example, Figure 3-29 shows the controller status for
AnimateCamera, which is a Repeat loop controller module.
The distinguishing characteristic of a loop controller module is its
ability to break its loop. IRIS Explorer has
While
and
Repeat
modules whose sole function is to control While and Repeat loops, but other
modules can also function as loop controllers.
Table
3-4
lists the IRIS Explorer loop controllers
Even though IRIS Explorer allows you to change controllers, the change may
not make sense from a programmatic point of view. It is up to you to make
sure that the looped map makes computational sense and that it will
terminate.
A loop fires until the loop controller detects an end-of-loop condition
and stops the loop. To fire a loop, or to start up a loop that has been
terminated, you can fire the loop controller module. The controller module
can always cause its loop to iterate if you change one of its widgets.
In addition, any module outside the loop or upstream of the loop
controller can start the loop. If you have a Repeat loop, where the
controller is at the end of the loop, this includes modules in the loop as
well upstream of the loop itself. In a While loop, upstream modules are all
outside the loop.
If a frame results from a parameter change in a module inside a loop, the
While controller will not restart the loop, whereas the Repeat controller
will, because the frame came from upstream. This is important when, for
example,
Streakline
is in a loop with
Render. If a parameter changes in
Streakline,
Render
can keep the loop going.
Controller modules such as
While
and
Repeat
pass their data through like a transistor, turning off the flow by sending a
sync frame when their Condition port parameter becomes zero.
Other controller modules, like
Render, do not really control iteration, but need to be control
modules in order to support their normal wiring paradigms, such as picking in
the
Render--QueryLat
map (see
Figure
3-27).
Render
needs to be a Repeat controller so that any module in the loop can start the
loop.
When you wire a loop in a map, you must include a loop controller module
in the loop. If you try to close a loop without a loop controller, you will
get a message saying the connection has failed because there is no controller
present.
You can have:
You cannot have intertwined loops, where two control modules are each in
the other's loop, or where a single module is controlled by more than one
controller.
Each loop controller module has an additional synchronisation port
Loop Ended. When the module is the active controller you can wire this
port to the
Fire
port of another module outside of the loop, to cause that module to fire
when the loop completes: when the loop controller has detected the
end-of-loop condition and stops the loop. This can be useful to control
nested loops, as demonstrated in the example map
/usr/explorer/maps/AnimateIso.map.
Figure
3-30
shows the wiring of the nested loops within this map.
AnimateCamera
is the loop controller for the inner loop and sends cameras to
Render.
For
controls the outer loop. The
Loop Ended
port of
AnimateCamera
is wired to the
Fire
port of
For, to start the next iteration of this outer loop.
The special coloring of loop control arcs (see
Figure
3-31) can help you understand loops. Each loop has a single control arc,
which is adjacent to the loop controller that governs it. The control arc is
upstream
of a While controller and
downstream
of a Repeat controller. A control arc is conceptually treated as
broken
by IRIS Explorer when it is computing which modules lie upstream of one
another.
The special control arc wiring helps to clarify otherwise ambiguous loops,
such as the one in
Figure
3-32, which shows a symmetrical map with separate While loop controllers
for each nested loop. Either
While
module can control loop 3. You will be able to deduce which module controls
loop 3 by reading the controller arcs. You can change which module controls
loop 3 by selecting arcs and controller buttons carefully.
If you save a map or part of a map that contains a loop, IRIS Explorer
saves the identity of the active controller and will restore the map with
this configuration.
In general, you would group most loops that perform a complex iteration.
However, controller capability cannot be promoted from the controller module
in the loop to the group module. If you wire a group module into a loop, the
loop must include its own separate controller. In this case, the grouped loop
constitutes a nested loop in the map.
An iterating loop may be terminated by the controller module, or it may be
interrupted by the Map Editor. This is called
breaking the loop,
which is different from
disconnecting the loop,
where inter-module connections are removed.
In the Map Editor, you can also use the
Break Loop
option, which appears only on the module pop-up menu of active loop
controllers (see
Figure
3-33). It forcibly terminates a looping cycle.
If your looping map seems to be hogging resources with execution
highlighting on, try switching it off before you initiate a loop.
This module is used to create a single executable process from a group of
ImageVision Library (IL) modules. The module takes map file information about
the constituent modules and their ports and connections, and creates an IL
operator for each IL module in the map. It then chains these operators to
execute the modules, in effect creating a single executable process from all
the alternate module executables.
The IL Controller module sits between the ImageVision Library and IRIS
Explorer. It is similar to the dataScribe module that uses a scribe file,
except that the IL Controller module uses a map file. There must be both a
modulename.map
file and an
.mres
file for the module to function.
To use the IL Controller module, this is the procedure you follow:
The main reasons for using the IL Controller module to execute a map are:
This is because the IL execution module is a
pull
model and requires much less information to compute a large image than IRIS
Explorer, which uses a
push
execution model.
Resetting the Color Bands
Selecting an Output Mode
Setting the Domain Limits
Selecting a Color Band
Adding and Removing Control Points
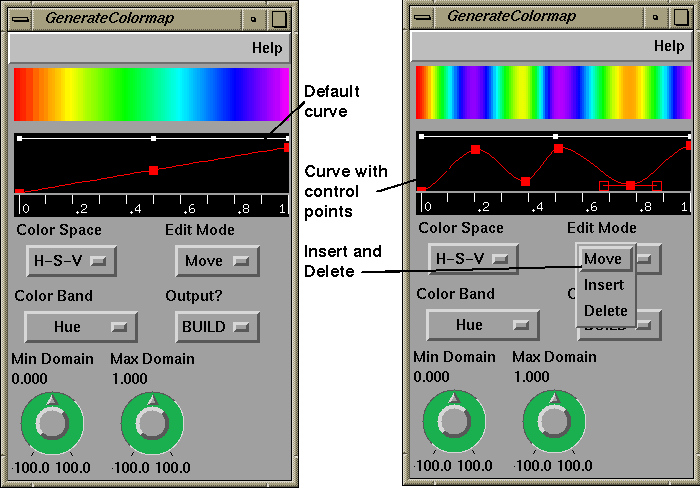
Figure 3-2 Adding Control Points to a Color Band
Using Slope Control Points
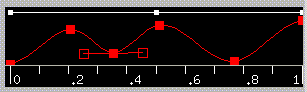
Figure 3-3 Slope Control Points
Using Custom Colormaps
Creating a Custom Colormap
Saving a Colormap
Figure 3-4 A Map using GenerateColormap
Generating a Lattice
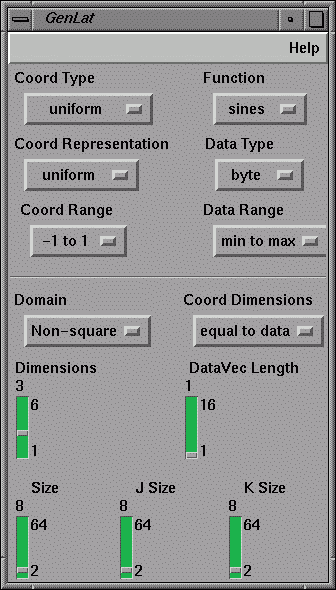
Figure 3-5 The GenLat Module
Setting Lattice Parameters
Controlling Lattice Size
Lattice Coordinates
All lattices created by GenLat have coordinates, which can be
represented as uniform, perimeter, or curvilinear. The data values of
the coordinates govern the visual shape of the lattice. For example,
the torus shape produces a lattice whose coordinates are polar
in the first two dimensions and linear in the others.
Data Values
Displaying a Lattice
Slicing Volumetric Data
Output
Input
Uniform
Perimeter
Curvilinear
Uniform
OrthoSlice, Slice
-
-
Perimeter
-
OrthoSlice
-
Curvilinear
OrthoSlice
OrthoSlice
OrthoSlice
Pyramid
-
-
ProbeLat
Using OrthoSlice
The simplest way to slice data is to use
OrthoSlice
(see
Figure
3-6). This module extracts a 2D lattice from a 3D uniform,
perimeter, or curvilinear lattice along one of the orthogonal axial
planes. The output can have different coordinate
representations. Curvilinear coordinates are output by default. If
desired, the output may have the same coordinates as
the input lattice, except that the lattice is 2D. When in this
mode, if you feed in a 3D uniform lattice, OrthoSlice
produces a 2D uniform lattice.
(footnote)
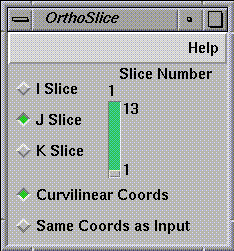
Figure 3-6 The OrthoSlice Module
Figure 3-7 Slicing a Volume with OrthoSlice
Using Slice
The Slice module (see Figure
3-8) extracts a 2D uniform slice out of a 3D uniform lattice.
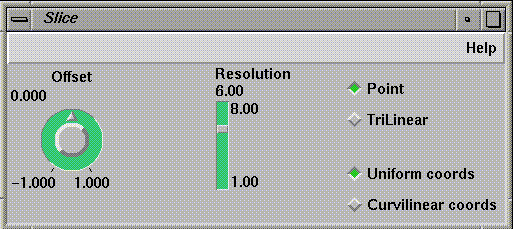
Figure 3-8 The Slice Module
The size of the slice lattice can be larger than the original lattice,
depending on the slice plane. At certain angles, the slice may extend
beyond the bounds of the original lattice (see Figure
3-9), but the lattice is clipped to keep the number of samples
outside the bounds to a minimum.
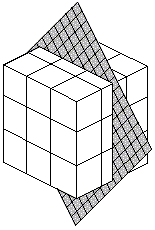
Figure 3-9 Slice Extended Beyond Lattice Bounds
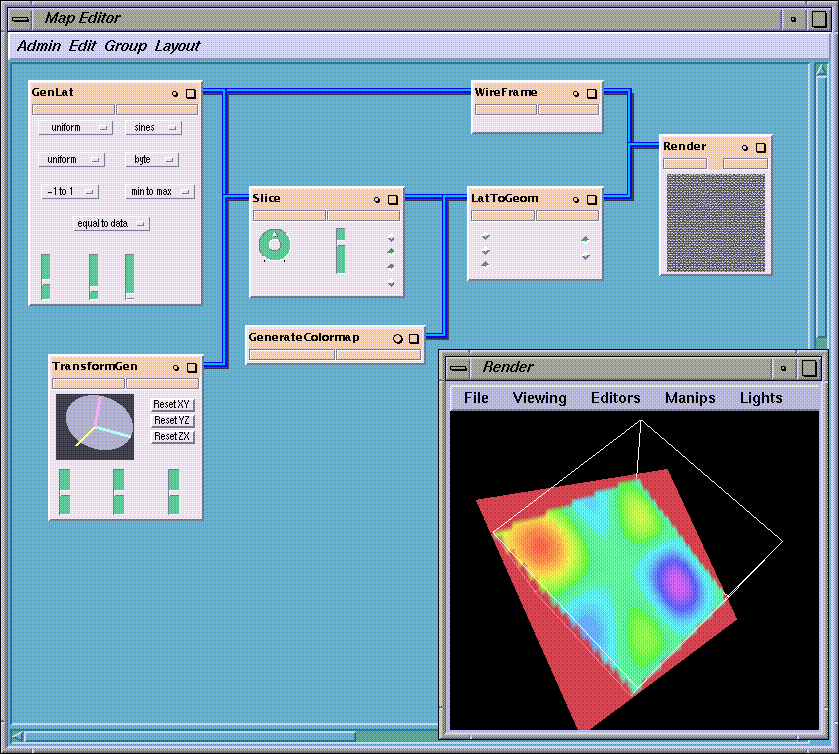
Figure 3-10 Slicing a Volume with Slice
Using ProbeLat
The
ProbeLat
module works only with curvilinear lattices, and its action is not restricted
to plane surfaces (see
Figure
3-11).
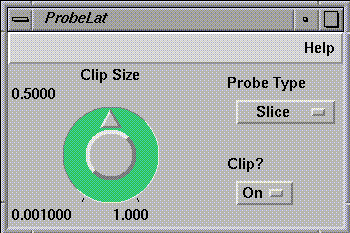
Figure 3-11 The ProbeLat Module
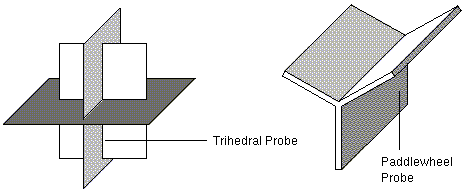
Figure 3-12 Probe Forms
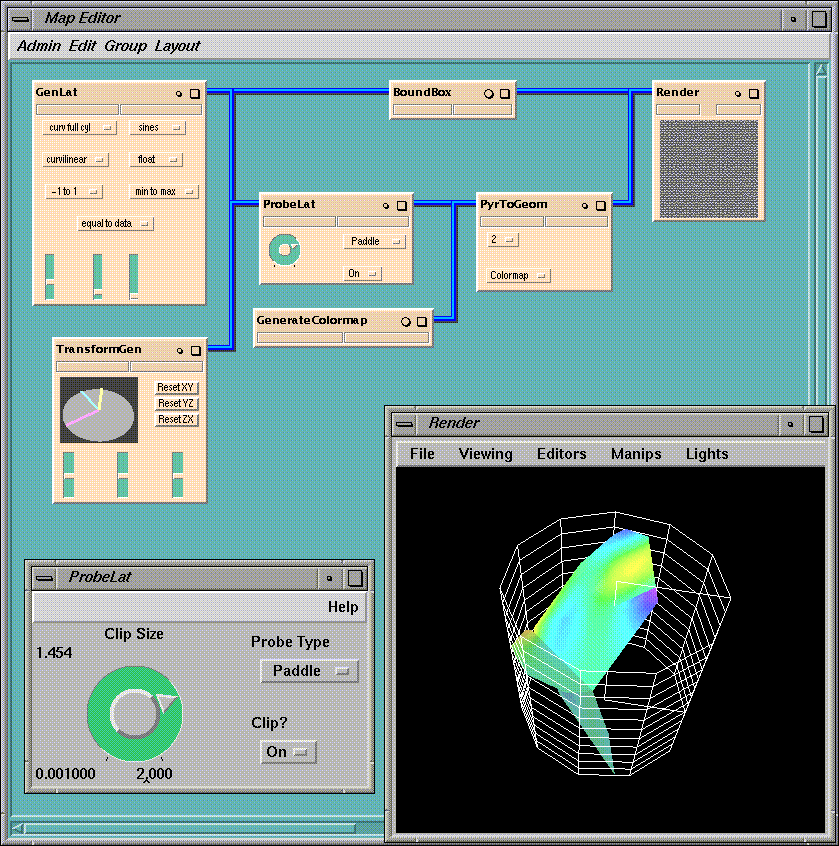
Figure 3-13 Slicing a Volume with ProbeLat
Generating a Histogram
Figure 3-14 The Histogram Module
Displaying Histograms
Sorting the Data
Selecting Channels
Displaying Images
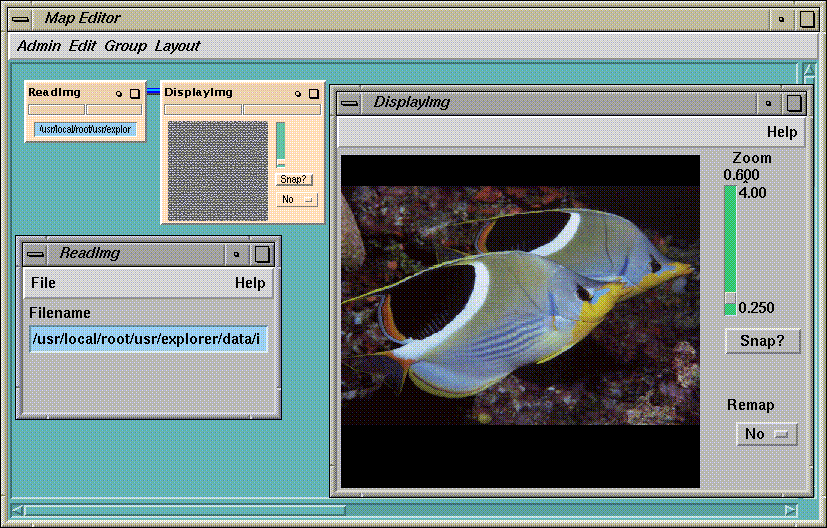
Figure 3-15 An Image in the DisplayImg Module
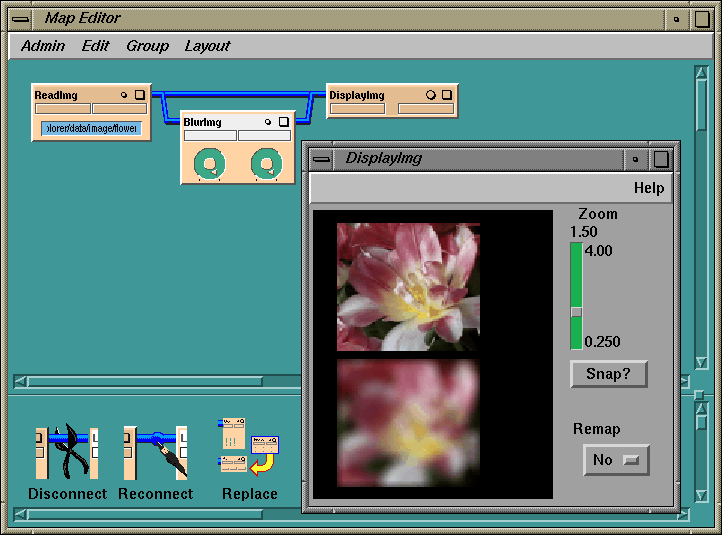
Figure 3-16 Example Showing Two Images in DisplayImg
Visualizing Data
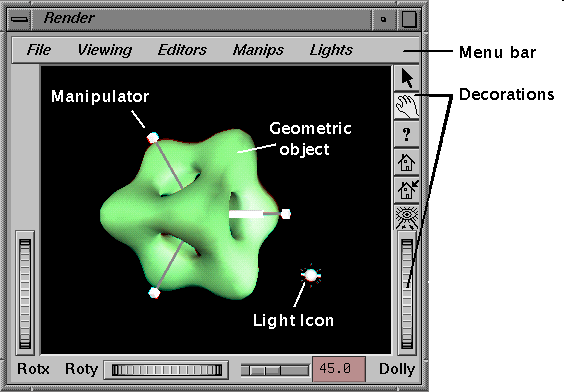
Figure 3-17 The Render Module
Ports on Render
Modes of Operation
Selecting an Object
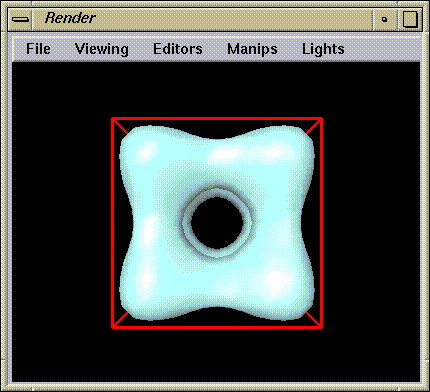
Figure 3-18 A Selected Object
Moving an Object
Using the Pop-up Menu
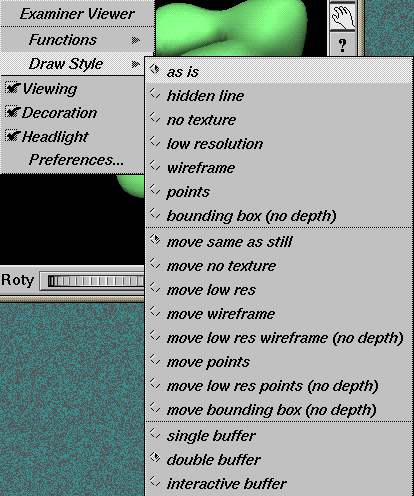
Figure 3-19 Render Pop-up Menu
Using Graphical Shortcuts
Figure 3-20 The Render Decorations
Wireframe Rendering
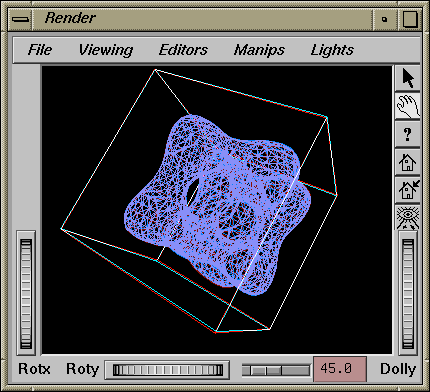
Figure 3-21 Wireframe Object in Render
Editing Object Properties
Editors
Purpose
Material Editor
Sets the material properties of ambient, diffuse, and specular color,
shininess, and transparency.
Color Editor
Brings up a graphical color editor that lets you set the diffuse color on
an object.
Transform Sliders
Sets the exact placement, scale, and orientation of the object in the
window.
Using the Material Editor
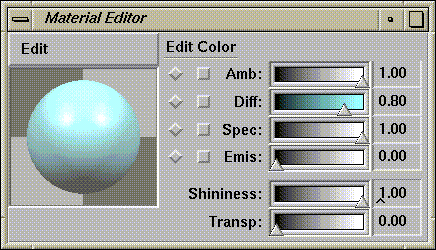
Figure 3-22 The Material Editor
Using the Color Editor
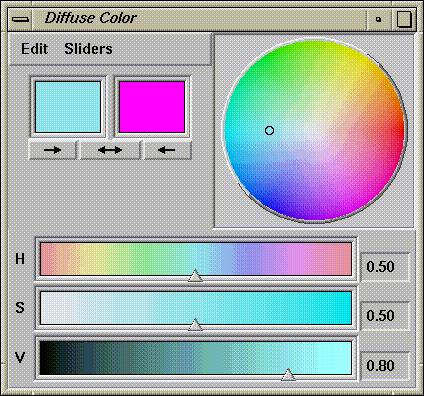
Figure 3-23 The Color Editor
Using the Transform Sliders
![]()
Figure 3-24 The Transform Sliders
Displaying Transparent Objects
Changing the Lighting
Editing a Light
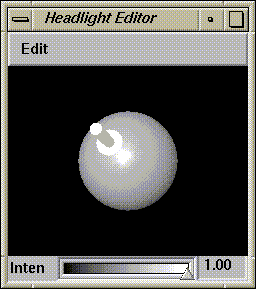
Figure 3-25 Light Editor
Manipulating Objects
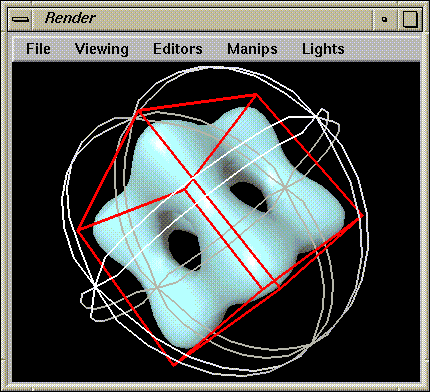
Figure 3-26 The Trackball Manipulator
Constructing Loops
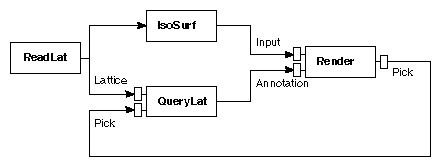
Figure 3-27 A Loop in a Map
Defining a Loop
Loop Controllers
Each loop must contain a loop controller module which controls and
terminates loop iteration. In While loops, the loop controller checks
the condition at the start of the loop, and in Repeat loops, at the
end of the loop. The While or Repeat sense of the loop is determined
by the While or Repeat capability of the module controlling the
loop. Loop controllers have either While or Repeat capability, but not
both.
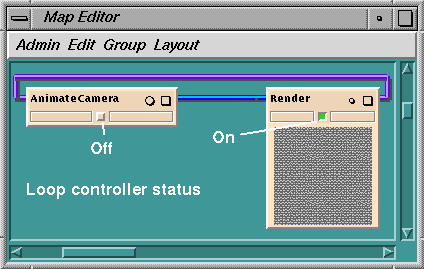
Figure 3-28 Loop Controller Modules
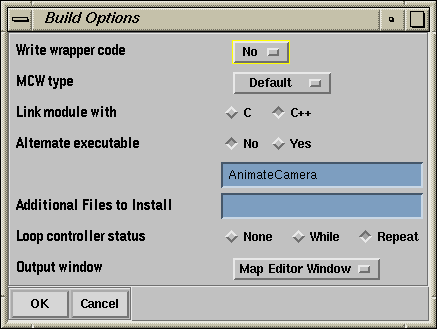
Figure 3-29 Build Options for Loop Controller
While Loops Repeat Loops For AnimateCamera NAGAdvectAnimate Render Trigger Repeat While How Loops Work
There can be only one active loop controller in a loop. If the loop
contains more than one module with loop controller capability, IRIS Explorer
selects the active loop controller, based on information from the loop
connections. You can change the active controller by clicking on the loop
icon. A message appears asking for confirmation.
Wiring a Loop
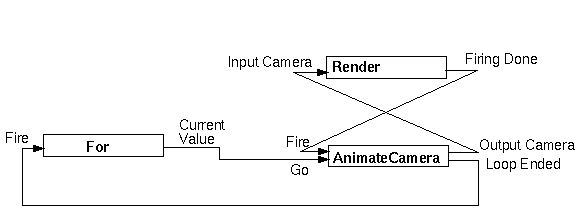
Figure 3-30 Loop Wiring in AnimateIso Map
Control Arcs
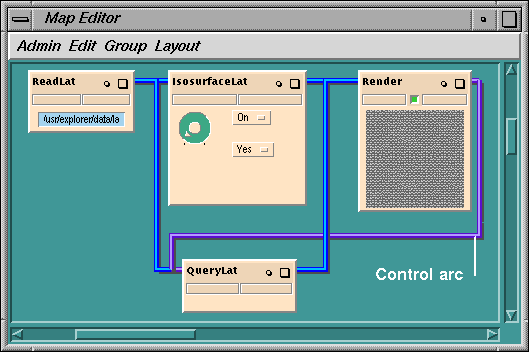
Figure 3-31 Looping Control Arc
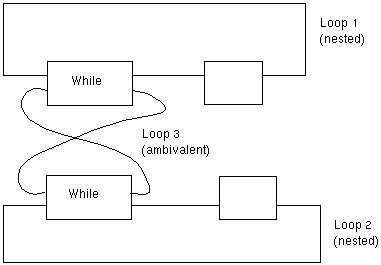
Figure 3-32 Ambiguous Looping Scheme
Saving Loops
Halting a Loop Iteration
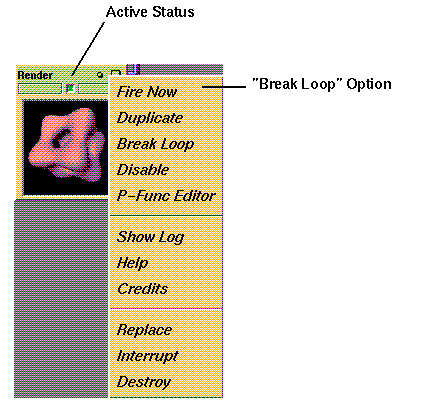
Figure 3-33 Module Menu on Active Loop Controller
The IL Controller Module
Last modified: Mon Oct 13 15:06:52 1997
[ Documentation Home ]