Overview
| Week |
Dates |
Topic |
Topic |
HW |
Lab |
| 1 |
Aug 21, 23 |
Introduction |
InfoVis overview |
HW 1 |
| 2 |
Aug 28, 30 |
Multivariate data & tables |
Statistical Graphs |
|
Lab 1 |
| 3 |
Sep 4, 6 |
Visual perception |
Design practice & Data Illustrator |
HW 2
| Lab 2 |
| 4 |
Sep 11, 13 |
Multivariate visual reps. 1 |
Multivariate visual reps. 2 |
|
Lab 3 |
| 5 |
Sep 18, 20 |
Interaction |
Overview & detail |
|
Lab 4 |
| 6 |
Sep 25, 27 |
Tasks and analysis |
InfoVis systems & toolkits |
HW 3
| Lab 5 |
| 7 |
Oct 2, 4 |
Storytelling |
Poster session |
|
| 8 |
Oct 9, 11 |
No Class - Fall break |
Post-WIMP interaction |
|
Lab 6 |
| 9 |
Oct 16, 18 |
Tufte's design principles |
Geospatial visualization |
|
Lab 7 |
| 10 |
Oct 23, 25 |
Time series data |
(No class) Value of visualization |
| 11 |
Oct 30, Nov 1 |
Text & documents 1 |
Text & documents 2 |
HW 4 |
|
| 12 |
Nov 6, 8 |
Hierarchies & trees 1 |
Hierarchies & trees 2 |
HW 5
| Lab 8 |
| 13 |
Nov 13, 15 |
Graphs and networks 1 |
Graphs and networks 2 |
|
Lab
9/Lab 10 |
| 14 |
Nov 20, 22 |
Evaluation |
No Class - Thanksgiving break |
|
| 15 |
Nov 27, 29 |
Visual analytics |
Exam |
|
| 16 |
Dec 4, 7 |
Casual InfoVis |
(Project demos) |
| 17 |
Dec 10* |
Project video presentations |
2:40-5:30pm |
Detail
Below are summaries of all the materials for each class. References
for readings and articles, videos shown, websites referenced, and
software demonstrated are listed for each topic. The lecture slides
are included in Canvas.
Aug. 21 -- Introduction
Class Slides
In Canvas
Post Reading
Tufte Shuttle recap
Websites
Video of
accident on youtube
Tufte's
book containing Challenger discussion
Report
of the Presidential Commission on the Space Shuttle Challenger
Accident
Challenger
disaster - Wikipedia page about accident
Weather's
role in the disaster (weather.com)
Challenger engineer blames himself
Challenger crew - What happened (gawker.com)
Criticism
of Tufte's analysis from Online Ethics Center for Engineering and
Research
Aug. 23 -- InfoVis Overview
Pre Reading
Data Visualization Versus UI and Data Science, L. Cherny
Post Reading
S. Card, J. Mackinlay and B. Shneiderman, Readings in
Information Visualization, Using Visualization to Think Morgan Kaufmann,
1999, pp. 1-34.
Relevant
S. K. Card, "Information visualization." In The Human-Computer
Interaction Handbook, J. Jacko, A. Sears,
(editors), Lawrence Erlbaum Associates; 2003.
J.-D. Fekete, J. van Wijk, J. Stasko, C. North, "The
Value of Information Visualization", in Information Visualization:
Human-Centered Issues and Perspectives, (Editors: A. Kerren,
J. Stasko, J.-D. Fekete, C. North), Springer, 2008, pp. 1-18.
C. North, "Information Visualization", in Handbook of Human
Factors and Ergonomics, G. Salvendy (editor), John Wiley & Sons, 2005.
Websites
Anscombe's
Quartet
Nuclear arms race - visual.ly
Death
and Taxes - visual.ly
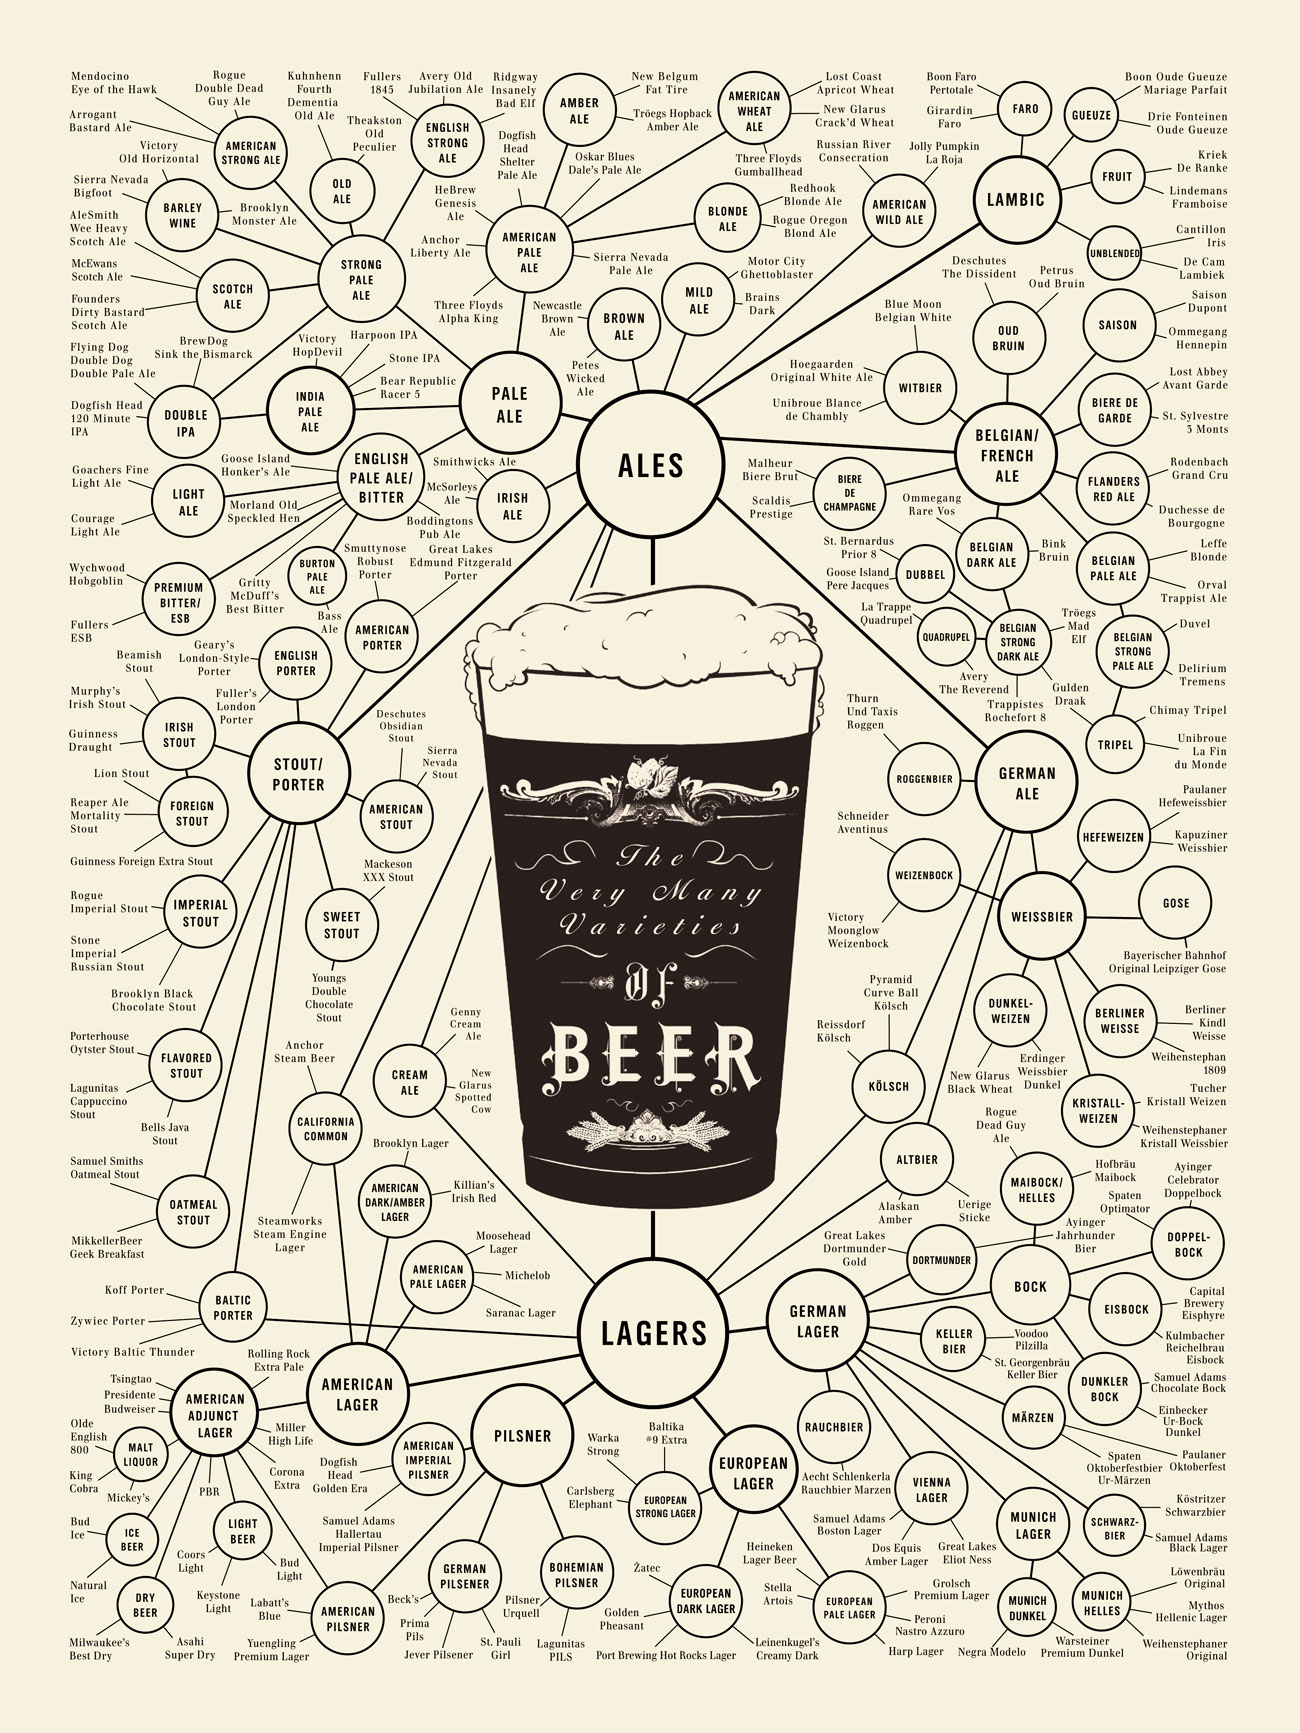
Best
beer in America
- Mike Wirth Art
Beer -
Beer graph
Religious
belief and income - awesome.good.is
Where
We Live
- Joe Lertola
60
Silliest pie charts - twentytwowords.com
FOX News pie chart
NameVoyager
of the Baby Name Wizard
Use
of candidate's names - from the NY Times
Netflix
Queues - from the NY Times
InfoVis Wiki
Flowing Data
Scoop.It!
The
Economist's Graphic Detail
Visualization
Blog Compendium
Aug. 28 -- Multivariate Data & Tables
Pre Reading
Art
and Science of the scatterplot, Pew Research
Dear Data
Websites
Not applicable data, stephaniegreen
Trifacta - Data wrangling
Videos
Data
cleaning using Trifacta's Wrangler
LastHistory,
InfoVis '10
Aug. 30 -- Statistical Graphs
Pre Reading
Use
Pie Charts?, policyviz.com
"Effectively
Communicating Numbers - Selecting the Best Means and Manner of
Display", S. Few, 2006.
Relevant
S. Few, Show Me the Numbers, Analytics Press, 2004.
S. Few, Now You See It, Analytics Press, 2009.
Websites
When
to use Bump Charts, K. Flerlage
Chartopedia,
anychart.com
Dataviz Project by ferdio
2016
Best and weirdest charts from fivethirtyeight.com
Sep. 4 -- Visual Perception
Pre Reading
Choosing
Colors for Data Visualization, M. Stone, 2006.
Viz Palette for Data Visualization Color, E. Meeks
Relevant
V. Setlur and M. Stone, "A Linguistic Approach to Categorical
Color Assignment for Data Visualization", IEEE Trans. on Visualization
and Computer Graphics, Vol. 22, No. 1, Jan. 2016, pp. 698-707.
Videos
Color
in political maps from the Daily Show
Himba
see colors differently
Change
blindness picture examples, from UBC
Change
blindness video examples, from Dan Simons at Illinois
Websites
C. Healey, "Perception
in Visualization," NC State
Color Brewer, C.
Brewer
Colorgorical, Brown Univ.
Viz Palette,
seeing colors in action, E. Meeks & S. Lu
chroma.js
JavaScript library for helping work with colors, G. Aisch
Checker
shadow illusion, Wikipedia
Color selector
algorithm, Tableau
Interactive color challenge
Color
names from xkcd
Color
resources, If We Assume
The
little of vis design, from visualisingdata.com, A. Kirk
39
studies about human perception, from K. Elliott
Sep. 6 -- Designing Vizes & Data Illustrator
Pre Reading
Design and Redesign in Visualization, Viegas & Wattenberg
Post Reading
A. Vande Moere and H. Purchase, "On the role of Design in
Information Visualization", Information Visualization,
Vol. 10, No. 4, pp. 356-371, 2011.
Relevant
Z. Liu, J. Thompson, et al, "Data Illustrator: Augmenting Vector
Design Tools with Lazy Data Binding for Expressive Visualization
Authoring", Proc. of CHI '18, Apr. 2018.
Websites
One data set visualized 25 ways, N. Yau
Data Illustrator
Sep. 11, 13 -- Multivariate Visual Representations
Relevant
A. Inselberg, "Multidimensional Detective," Proceedings of
IEEE InfoVis '97, pp. 100-107, 1997.
D. Keim, M. Hao, U. Dayal, and M. Hsu, "Pixel Bar
Charts: A visualization technique for very large multi-attribute data
sets", Information Visualization, Vol. 1, No. 1, March 2002,
pp. 20-34.
B. Alsallakh, L, Micallef, W. Aigner, H. Hauser,
S. Miksch, P. Rodgers, "Visualizing Sets and Set-typed Data:
State-of-the-Art and Future Challenges." State-of-the-Art Reports of
the Eurographics Conference on Visualization 2014 (EuroVis 2014),
June 2014.
J.H.T. Claessen, J. van Wijk, "Flexible Linked Axes for
Multivariate Data Visualization," IEEE Trans. on Visualization
and Computer Graphics, Vol. 17, No. 12, Dec. 2011, pp. 2310-2316.
S. Gratzl, A. Lex, N. Gehlenborg, H. Pfister, and M. Streit,
"LineUp: Visual Analysis of Multi-Attribute Rankings", IEEE
Trans. on Visualization and Computer Graphics, Vol. 19, No. 12,
pp. 2277-2286, Dec. 2013.
R. Rao and S.K. Card, "The Table Lens: Merging Graphical
and Symbolic Representations in an Interactive Focus+Context
Visualization for Tabluar Information",
Proceedings of ACM CHI '94, Apr. 1994, pp. 318-322.
J.M. Rzeszotarski and A. Kittur. "Kinetica:
naturalistic multi-touch data visualization." Proc. of CHI '14,
pp. 897-906.
M. Spenke, C. Beilken, T. Berlage, "FOCUS: The
Interactive Table for Product Comparison and Selection." Proceedings
of ACM UIST '96, Nov. 1996, pp. 41-50.
J. S. Yi, R. Melton, J. Stasko, and J. Jacko, "Dust &
Magnet: Multivariate Information Visualization using a Magnet
Metaphor," Information Visualization, Vol. 4, No. 4, Winter 2005,
pp. 239-256.
Websites
Chernoff
faces
The Women of Data
Viz, by Alli Torban
Nation's
World Cup appearances, Sonja Kuijpers
Parallel
coordinates, Julian Heinrich
Parallel Sets, UNCC, InfoVis '05
Chicago
police detainees, the Guardian
Gun
deaths in the US, FiveThirtyEight
Spending
at Trump properties, Axios
Videos
Voyager, Washington,
InfoVis '16
Table Lens, Xerox PARC, CHI '95
EZChooser, MERL
LineUp,
Linz & Harvard, InfoVIs '03
FLINA View, TU Eindhoven, InfoVis '11
Dust
& Magnet, Georgia Tech, Information Visualization '05
Dust
& Magnet on MSR Hub, Georgia Tech, '16
Kinetica,
CMU, CHI '14
SandDance, Microsoft Research
Untangling Euler Diagrams, MSR, InfoVis '10
OnSet, Georgia Tech, InfoVis '14
Software
LineUp, Caleydo
Parallel Sets, UNCC
SandDance, Microsoft Research
OnSet, Georgia Tech, InfoVis '14
Sep. 18 -- Interaction
Pre Reading
Why
are we doing fewer interactive graphics?, A. Tse, NYT
Deputy Graphics Editor (review the slides of the talk)
The
death of interactive infographics?, D. Baur
In
Defense of Interactive Graphics, G. Aisch, NYT
Post Reading
J.S. Yi, Y.A. Kang, J.T. Stasko and J.A. Jacko, "Toward a
Deeper Understanding of the Role of Interaction in Information
Visualization", IEEE Transactions on Visualization and Computer
Graphics, Vol. 13, No. 6, Nov/Dec 2007, pp. 1224-1231.
Relevant
A. Dix and G. Ellis, "Starting Simple - adding value to static
visualisation through simple interaction."
Proc. of AVI '98, May 1998, pp. 124-134.
N. Elmqvist, A. Vande Moere, H-C. Jetter, D. Cernea, H. Reiterer,
and TJ Jankun-Kelly, "Fluid interaction for
information visualization", Information
Visualization, Vol. 10, No. 4, Oct. 2011, pp. 327-340.
J. Heer and G. Robertson. "Animated Transitions in
Statistical Data Graphics," IEEE Transactions on Visualization and
Computer Graphics Vol. 13, No. 6, Nov.-Dec. 2007, pp. 1240-1247.
J. Heer, M. Agrawala, W. Willett, "Generalized Selection via
Interactive Query Relaxation", Proc. of CHI '08, Apr 2008, pp. 959-968.
R. Sadana and J. Stasko, "Designing and Implementing an
Interactive Scatterplot Visualization for a Tablet Computer",
Proc. of AVI '14, May 2014, pp. 265-272.
B. Shneiderman, "Dynamic Queries for Visual Information Seeking",
IEEE Software, Vol. 11, No. 6, pp. 70-77, 1994.
Videos
Generalized Selection, Stanford, CHI '08
FacetMap, MSR, InfoVis '06
FilmFinder, Univ. Maryland, CHI '94
Magic Lens & See Through Tools, Xerox PARC, CHI '94 & '95
DynaVis animation, MSR, InfoVis '07
Dust
& Magnet, Georgia Tech, Information Visualization '05
OnSet, Georgia Tech, InfoVis '14
Software
HomeFinder, Univ. of Maryland download
Spotfire
OnSet, Georgia Tech, InfoVis '14
Websites
Interactive
histogram from Alan Dix
Visual Thesaurus
NameVoyager
of the Baby Name Wizard
Google maps mash-up of
homefinder style tool
Diamond
finder with dynamic queries
Sep. 20 -- Overview and Detail (including Focus + Context and Zooming)
Pre Reading
Micro-macro
view superpower, D. Baur
Relevant
A. Cockburn, A. Karlson, and B. Bederson, "A Review of
Overview+Detail, Zooming, and Focus+Context Interfaces", ACM
Computing Surveys, Vol. 41, No. 1, Dec. 2008, pp. 2:1-2:31.
B. Bederson, J. Meyer, L. Good, "Jazz: An Extensible Zoomable
User Interface Graphics Toolkit in Java", Proceedings of UIST 2000,
Nov. 2000, pp.171-180.
B. Bederson et al, "DateLens: A fisheye calendar interface for
PDAs," ACM Trans. on CHI, Vol. 11, No. 1, March 2004, pp. 90-119.
G. Furnas, "Generalized Fisheye Views", Proc. of CHI '86, pp. 16-23.
G. Furnas and B. Bederson, "Space-Scale Diagrams: Understanding
Multiscale Interfaces", Proc. of CHI '95, May 1995, pp. 234-241.
G. W. Furnas, "A fisheye follow-up: further reflections on focus
+ context", Proc. of CHI '06, April 2006, pp. 999-1008.
C. Plaisant, D. Carr, and B. Shneiderman,
"Image-Browser Taxonomy and Guidelines for Designers",
IEEE Software, Vol. 12, No. 2, pp. 21-32, March 1995.
M. Sarkar and M. H. Brown, "Graphical fisheye views",
Communications of the ACM, Vol. 37, No. 12, pp. 73-84, Dec. 1994.
Videos
Powers
of Ten, by Eames
PadPrints, New Mexico, UIST '98
PhotoMesa,
Maryland, UIST '01
FacetZoom, CHI '08
Information Mural, Georgia Tech, InfoVis '95
Fisheye
Views of Graphs, DEC SRC, CHI '93
Table Lens, Xerox PARC, CHI '95
DateLens,
Maryland & MSR
Websites
Powers of 10
Scale of the Universe 2 -
Zooming example
prezi.com
Selfiecity
DateLens,
Maryland
Sep. 25 -- User Tasks and Analysis
Pre Reading
Banning
exploration in my infovis class, by E. Adar
Relevant
R. Amar, J. Eagan, and J. Stasko, "Low Level Components of
Analytic Activity in Information Visualization", Proc. of IEEE
InfoVis '05, Oct. 2005, pp. 111-117.
R. Amar and J. Stasko, "Knowledge Precepts for Design and
Evaluation of Information Visualizations," IEEE Transactions on
Visualization and Computer Graphics, Vol. 11, No. 4, July/August 2005,
pp. 432-442.
M. Brehmer and T. Munzner, "A Multi-Level Typology of Abstract
Visualization Tasks",
IEEE Trans. on Visualization and Computer Graphics, Vol. 19,
No. 12, Dec. 2013, pp. 2376-2385.
D. Norman, "The Power of Representation", Chapter 3 in Things That Make
Us Smart: Defending Human Attributes in the Age of the Machine,
Addison-Wesley, 1994.
A. Rind, W. Aigner, M. Wagner, S. Miksch, and T. Lammarsch,
"Task Cube: A three-dimensional conceptual space of user tasks in
visualization design and evaluation", Information Visualization,
Vol. 15, No. 4, pp. 288-300, 2015.
H.J. Schulz, T. Nocke, M. Heitzler, and H. Schumann,
"A Design Space of Visualization Tasks", IEEE Trans. on
Visualization and Computer Graphics, Vol. 19,
No. 12, Dec. 2013, pp. 2366-2375.
K. Sedig, P. Parsons, A. Babanski, "Towards a Characterization of
Interactivity in Visual Analytics" JMPT, Vol. 3, No. 1, 2012,
pp. 12-28.
M. Sedlmair, M. Meyer, T. Munzner, "Design Study Methodology:
Reflections from the Trenches and Stacks", IEEE Transactions on
Visualization and Computer Graphics, Vol. 18, No. 12, Dec. 2012,
pp. 2431-2440.
B. Shneiderman, "The Eyes Have It: A Task by Data Type Taxonomy for
Information Visualizations." Proc. 1996 IEEE Visual Languages,
Sept. 1996, pp. 336-343.
Sep. 27 -- InfoVis Systems & Toolkits
Relevant
F. Viegas, M. Wattenberg, F. van Ham, J. Kriss, and
M. McKeon, "ManyEyes: A Site for Visualization at Internet
Scale", IEEE Trans. on Visualization and Computer Graphics,
Vol. 13, No. 6, Nov.-Dec. 2007, pp. 1121-1128.
M. Bostock, V. Ogievetsky, J. Heer, "D3: Data-Driven Documents",
IEEE Trans. on Visualization and Computer Graphics, Vol. 17,
No. 12, Dec. 2011, pp. 2301-2309.
J. Heer, F. Viegas, M. Wattenberg, "Voyagers
and Voyeurs: Supporting Asynchronous Collaborative Information
Visualization", Proceedings of ACM CHI 2007, April 2007,
pp. 1029-1038.
J. Heer, "Software Design Patterns for Information Visualization",
IEEE Transactions on Visualization and Computer Graphics,
Vol. 12, No. 5, September 2006, pp. 853-860.
J. Heer and M. Bostock. "Declarative Language Design
for Interactive Visualization." IEEE Trans. on Visualization
and Computer Graphics, Vol. 16, No. 6, Nov. 2010, pp. 1149-1156.
D. Ren, T. Holerer, X. Yuan, "iVisDesigner: Expressive
Interactive Design of Information Visualizations", IEEE
Trans. Visualization and Computer Graphics, Vol. 20, No. 12,
Dec. 2014, pp. 2092-2101.
A. Satyanarayan and J. Heer. "Lyra: An Interactive
Visualization Design Environment." Computer Graphics Forum,
Vol. 33, No. 3, June 2014, pp. 351-360.
C. Stolte, D. Tang and P. Hanrahan, "Polaris: A System for
Query, Analysis and Visualization of Multi-Dimensional Relational
Databases," IEEE Trans. on Visualization and Computer
Graphics, Vol. 8, No. 1, Jan-Mar 2002, pp. 52-65.
Web Articles
Many Eyes shut down
Visualising
Data's software resources list
Creative
Bloq's 37 best tools for data visualization
Profitbrick's
39 Data visualization tools for big data
Top
20 Data Visualization Tools from UIE
One
Chart, 12 Tools from Lisa Charlotte Rost
Data
visualization projects on GitHub
Frustrations
with DataViz Tools, J. McChesney
Videos
Using
ManyEyes 1
Using
ManyEyes 2
SketchInsight, Microsoft
Software
Datawrapper
Chartbuilder
Statwing
Voyager, Univ. of Washington
Voyager 2, Univ. of Washington
Keshif, Univ. of Maryland
Voder,
Georgia Tech
Processing - Java
p5.js - Java
ggplot - R
ggplot2 - R
Shiny - R
matplotlib - python
pandas - python
Bokeh - python
Altair - python
D3 - javascript
Vega - javascript
Vega-Lite - javascript
dimple - javascript
react-vis -
javascript
JavaScript InfoVis
Toolkit - javascript
Aperture.js - javascript
HighCharts - javascript
Google
visualization and chart tools - javascript
WebGL - javascript
Lyra
iVisDesigner
Data-Driven Guides
iVoLVER
InfoNice
DataInk
Data Illustrator
Charticulator
Oct. 2 -- Storytelling
Pre Reading
A. Thudt, J. Walny, T. Gschwandtner, J. Dykes, J. Stasko,
"Exploration and Explanation in Data Driven Storytelling", chapter
in Data-Driven Storytelling, edited by N. Henry Riche,
C. Hurter, N. Diakopoulos, and S. Carpendale, CRC Press,
2018. (article in Canvas)
Relevant
N. Henry Riche, C. Hurter, N. Diakopoulos, and S. Carpendale
(editors), Data-Driven Storytelling, CRC Press, 2018.
J. Hullman and N. Diakopoulos, "Visualization Rhetoric: Framing
Effects
in Narrative Visualization." IEEE Trans. on Visualization and
Computer Graphics, Vol. 17, No. 12, Dec. 2011, pp. 2231-2240.
J. Hullman, S. Drucker, N. Riche, B. Lee, D. Fisher, and
E. Adar. "A
Deeper Understanding of Sequence in Narrative Visualization." IEEE
Trans. on Visualization and Computer Graphics, Vol. 19, No. 12,
Dec. 2013, pp. 2406-2415.
R. Kosara and J. Mackinlay. "Storytelling: The Next Step for
Visualization." Computer, Vol. 46, No. 5, May 2013, pp. 44-50.
E. Segel and J. Heer, "Narrative Visualization: Telling Stories
with Data", IEEE Trans. on Visualization and Computer Graphics,
Vol. 16, No. 6, Nov.-Dec. 2010, pp. 1139-1148.
Videos
Hans
Rosling talk - from TED Conference, 2006
Hans
Rosling talk - from TED Conference, 2007
Story
about Hans Rosling, Nature
An
Inconvenient Truth - Wikipedia page about film
How
Mariano Rivera Dominates Hitters - from the NY Times
David
McCandless talk - from TED Conference, 2010
Hans Rosling
updated - from the BBC
Websites
Data-Driven
Journalism
Collection of DDS EXamples, and framework of techniques used
Tufte
praises Megan Jaegerman
Obama
job chart discussion
Home and Away - Iraq
& Afghanistan casualties from CNN
What's Really Warming the World?from Bloomberg
The Fallen of WWII
The
Case for a New Type of Minimum Wage using Tableau StoryPoints
Bubble
to Bust Recovery from Bloomberg
Americans
are Completely Addicted to Trucks from Bloomberg
Street
Names from NY Times
Winning
over Virgina from Washington Post
Satellites
Orbiting Earth from Quartz
California's
Getting Fracked from Flagg, Craig, and Bruno
MBTA Data from WPI
Data USA
Film Dialog from Polygraph
Gun Deaths
from 538
NBA Draft, ThePudding
Chicago
Police Detainees, Guardian
Pop
Music Repetitiveness, ThePudding
Gender
Representation of Comic Superheros, ThePudding
How
Levees Increase Flooding, ProPublica
Skateboarding
Family
income and college
from NY Times
Drone Strikes
from Pitch Interactive
China's
economic slowdown
from the Guardian
Enhanced
State of the Union address 2011 - from whitehouse.gov
Information is
Beautiful - David McCandless' website
What
Killed the InfoGraphic?
Oct. 11 -- Post-WIMP Interaction with Visualizations
Relevant
T. Gao, M. Dontcheva, E. Adar, Z. Liu, and
K. G. Karahalios. "DataTone: Managing Ambiguity in Natural Language
Interfaces for Data Visualization". Proc. of UIST '15, pp.
489-500, Oct. 2015.
B. Lee, P. Isenberg, N. H. Riche, and S. Carpendale. "Beyond
mouse and keyboard: Expanding design considerations for information
visualization interactions." IEEE Trans. on Visualization and
Computer Graphics, Vol. 18, No. 12, pp. 2689-2698, Dec. 2012.
C. North, T. Dwyer, B. Lee, D. Fisher, P. Isenberg,
G. Robertson, and K. Inkpen. "Understanding multi-touch manipulation
for surface computing". Proc. of IFIP Conference on Human-Computer
Interaction, pp. 236-249, 2009.
R. Sadana and J. Stasko, "Expanding Selection for
Information Visualization Systems on Tablet Devices", Proc.
of ISS '16, Nov. 2016, pp. 149-158.
R. Sadana and J. Stasko, "Designing Multiple Coordinated
Visualizations for Tablets", Computer Graphics Forum,
Vol. 35, No. 3, June 2016, pp. 261-270.
V. Setlur, S. E. Battersby, M. Tory, R. Gossweiler, and
A. X. Chang, "Eviza: A natural language interface for visual analysis." In
Proc. of UIST '16, pp. 365-377, 2016.
A. Srinivasan and J. Stasko, "Orko: Facilitating Multimodal
Interaction for Visual Network Exploration and Analysis", IEEE
Trans. on Visualization and Computer Graphics, Vol. 24,
No. 1, Jan. 2018, pp. 511-521.
Websites
Touch
Interaction on Tablets, Georgia Tech
Natural
Visualization, Georgia Tech
Videos
Cambiera, Microsoft, Va. Tech
Tangere,
Georgia Tech
Expanding
Selection for InfoVis Systems on Tablet Devices, Georgia Tech
VisTiles,
TU Dresden
Big and
small displays, Maryland
DataInk,
Microsoft & Toronto
DataTone,
Adobe, Illinois, Michigan
Eviza, Tableau
Orko
intro
and usage
scenario, Georgia Tech
ImAxes - Immersive
Data Vis in Virtual Reality, Monash Univ.
Oct. 16 -- E. Tufte's Visual Design Principles
Post Reading
Tufte, Envisioning Information
Relevant
S. Bateman, et al, "Useful Junk? The Effects of Visual
Embellishment on Comprehension and Memorability of Charts",
Proceedings of CHI '10, April 2010, pp. 2573-2582.
M. Borkin, et al, "What Makes a Visualization
Memorable?", IEEE Trans. on Visualization and Computer
Graphics, Vol. 19, No. 12, Dec. 2013, pp. 2306-2315.
Websites
Tufte's website
Why charts should have a zero baseline
Declutter
this graph example, by Cole Nussbaumer Knaflic
Circle width versus area
Scrollytelling version of Minard's march
Nigel Holmes
website
WTF Visualizations
Junk charts
Most misleading charts of 2015 by quartz.com
Oct. 18 -- Geospatial Visualization
Relevant
Dykes, J., Wood, J. & Slingsby, A. (2010). Rethinking map legends with
visualization. IEEE Transactions on Visualization and Computer
Graphics, 16(6), pp. 890-899.
Wood, J., Badawood, D., Dykes, J. & Slingsby, A. (2011)
BallotMaps: Detecting name bias in alphabetically ordered ballot
papers. . IEEE Transactions on Visualization and Computer Graphics,
17(12), pp. 2384-2391.
Van Wijk, J. J. (2013). Unfolding the earth: myriahedral
projections. The Cartographic Journal.
Kraak, M. J. (2003, August). The space-time cube revisited from a
geovisualization perspective. In Proc. 21st International Cartographic
Conference(pp. 1988-1996).
Tominski, C., Schumann, H., Andrienko, G., & Andrienko,
N. (2012). Stacking-based visualization of trajectory attribute
data. IEEE Transactions on visualization and Computer Graphics,
18(12), 2565-2574.
Kraak, M. J., & Ormeling, F. (2011). Cartography: visualization of
spatial data. GuilfordPress.
Robinson, A. H. M., Muehrcke, J. L., Kimerling, P. C., & Guptill,
A. J. (1995). Elements of cartography (No. 526 E4).
Websites
Racial
dot map, Univ. Virginia
How
the country swung, Washington Post
How
Trump made gains, NY Times
European
population changes, interaktiv morgenpost
Different
units, different patterns, Lisa Charlotte Rost, datawrapper blog
Modern
Family vs. Duck Dynasty, NY Times
How
Amercia uses its land, Bloomberg
Atlanta Health
Observatory Ellie Zhang, Georgia Tech
Tips for
creating choropleth maps, Lisa Charlotte Rost, datawrapper blog
2016
election map from 538
Women
are defeating Trump, 538
How
Election Maps Lie, Washington Post
Is
US leaning red or blue?, Wired
Regions
of the US, NY Times
12
Notable Election Vis Techniques, visualisingdata
Software Tools
Leaflet
Turf
Unfolding
ColorBrewer
Videos
Cartographers
from the West Wing TV show
Unfolding the
Earth by Jarke van Wijk
London Bike
Trips Jo Wood, City niversity London
Oct. 23 -- Time Series Data
Pre Reading
Alternative
ways for visualizing timelines, Neil Richards
Relevant
W. Aigner, S. Miksch, W. Muller, H. Schumann, C. Tominski,
"Visual Methods for Analyzing Time-Oriented Data",
IEEE Trans. on Visualization and Computer Graphics,
Vol. 14, No. 1, Jan.-Feb. 2008, pp. 47-60.
L. Byron & M. Wattenberg,
"Stacked Graphs - Geometry & Aesthetics",
IEEE Trans. on Visualization and Computer Graphics,
Vol. 14, No. 6, Nov.-Dec. 2008, pp. 1245-1252.
H. Hochheiser and B. Shneiderman. "Dynamic query tools for time
series data sets: Timebox widgets for interactive exploration,"
Information Visualization, Vol. 3, No. 1, Spring 2004,
pp. 1-18.
T. Kapler and W. Wright, "GeoTime Information Visualization",
Information Visualization, Vol. 4, No. 2, Summer 2005,
pp. 136-146.
P. McLachlan, T. Munzner, E. Koutsofios, and S. North,
"LiveRAC: interactive visual exploration of system
management time-series data," Proc. of CHI '08, April 2008, pp. 1483-1492.
C. Plaisant, et al, "LifeLines: Visualizing Personal
Histories." Proc. of CHI '96, pp 221-227.
J. van Wijk and E. van Selow, "Cluster and Calendar based
Visualization of Time Series Data", Proc. of InfoVis '99, Oct. 1999,
pp. 4-9.
Videos
Lifelines & Lifelines2, Univ. Maryland, CHI '96, CHI '08
EventFlow,
Univ. of Maryland
LiveRAC,
UBC, CHI '08
Websites
The TimeViz Browser
US elections over time (animation), streamable.com
US
elections over time (no animation), NY Times
LifeLines, Maryland
LifeLines2, Maryland
Visual
History of Top Golfers, Ben Davis in Tableau Public
Visual
History of Top Women's Tennis Players, Guardian
Movie character timelines
Web
browser percentage of market
Movie
receipts over time from NY Times
Timeline
Storyteller, Microsoft
Connected
scatterplots example, NY Times
In
Praise of Connected Scatterplots, Alberto Cairo
DimpVis, UOIT
Connected
scatterplot, Northwestern
Animated geographic
tracks, 422south
Dissecting
a film trailer, NY Times
When
are Babies Born?, Scientific Americian
Shipping across the world
History
of Sampling
Software
TimeSearcher,
Maryland
Simile, time series widgets from MIT
Oct. 25 -- Value of Visualization
Pre Watching
Stasko EuroVis '14 Capstone Video
Relevant
J.-D. Fekete, J. van Wijk, J. Stasko, C. North, "The
Value of Information Visualization", in Information Visualization:
Human-Centered Issues and Perspectives, (Editors: A. Kerren,
J. Stasko, J.-D. Fekete, C. North), Springer, 2008, pp. 1-18.
D. Norman, "The Power of Representation", Chapter 3 in Things That Make
Us Smart: Defending Human Attributes in the Age of the Machine,
Addison-Wesley, 1994.
J. Stasko, "Value-Driven Evaluation of Visualizations",
Proc. of BELIV '14, Nov. 2014, pp. 46-53.
J. van Wijk, "The value of visualization," Proc. of Visualization
'05, Oct. 2005, pp.79-86.
R. Chang, C. Ziemkiewicz, T. M. Green, and W. Ribarsky. "Defining
Insight for Visual Analytics." IEEE Computer Graphics &
Applications, Vol. 29, No. 2, Feb. 2009, pp. 14-17.
J. Larkin, H.A. Simon, "Why a Diagram is (Sometimes) Worth Ten
Thousand Words", Cognitive Science, Vol. 11, No. 1, pp. 65-99,
1987.
Z. Liu, N. Nersessian, J. Stasko, "Distributed
Cognition as a Theoretical Framework for Information Visualization",
IEEE Transactions on Visualization and Computer Graphics,
Vol. 14, No. 6, Nov/Dec 2008, pp. 1173-1180.
Z. Liu and J. Stasko, "Mental Models, Visual Reasoning and
Interaction in Information Visualization: A Top-down Perspective",
IEEE Transactions on Visualization and Computer Graphics,
(InfoVis '10),
Vol. 16, No. 6, November/December 2010, pp. 999-1008.
Websites
Anscombe's
Quartet
Gun
ownership in NY from lohud.com
Oct. 30, Nov. 1 -- Text and Documents
Pre Reading
F. Viegas, M. Wattenberg,
"Tag Clouds and the Case for Vernacular Visualization",
interactions, Vol. 15, No. 4, Jul-Aug 2008,
pp. 49-52. (article in Canvas)
Relevant
D.A. Keim and D. Oelke, "Literature Fingerprinting: A New Method
for Visual Literary Analysis", Proc. of IEEE VAST '07, Oct. 2007,
pp. 115-122.
J. Chuang, D. Ramage, C.D. Manning, J. Heer, "Interpretation and
Trust: Designing Model-Driven Visualizations for Text Analysis",
Proc. of CHI '12, pp. 443-452.
C. Görg, et al, "Combining
Computational Analyses and Interactive Visualization for Document
Exploration and Sensemaking in Jigsaw", IEEE Trans.
on Visualization and Computer Graphics, Vol. 19, No. 10,
Oct. 2013, pp. 1646-1663.
S. Havre, B. Hetzler, and L. Nowell, "ThemeRiver: Visualizing Theme
Changes over Time", Proceedings of the 2000 IEEE Information
Visualization Symposium, Salt Lake City, Oct. 2000, pp. 115-123.
F. Viegas, S. Golder, and J. Donath,
"Visualizing Email Content: Portraying Relationships from
Conversational Histories", Proceedings of CHI 2006,
April 2006, pp. 979-988.
F. Viegas, M. Wattenberg, J. Feinberg, "Participatory
Visualization with Wordle", IEEE Trans. on Visualization
and Computer Graphics, Vol. 15, No. 6, Nov.-Dec. 2009,
pp. 1137-1144.
M. Wattenberg, F. Viegas,
"The Word Tree, an Interactive Visual Concordance",
IEEE Trans. on Visualization and Computer Graphics,
Vol. 14, No. 6, Nov.-Dec. 2008, pp. 1245-1252.
J. Wise, "Visualizing the Non-Visual: spatial analysis and
interaction with information from text documents," Proceedings of the
Information Visualization '95 Conference, Atlanta, GA, Oct. 1995,
pp. 51-58.
Videos
Mani-Wordle, Seoul Natl. Univ., InfoVis '10
Parallel
Tag Clouds, IBM, VAST '09
FeatureLens,
Maryland, CIKM '07
SentenTree,
Georgia Tech & Twitter
Bohemian Bookshelf, Calgary
PaperLens,
MSR, CHI '05
Jigsaw,
Georgia Tech, VAST '07
Jigsaw
(academic papers),
Georgia Tech, TVCG '13
Jigsaw
(car reviews),
Georgia Tech, TVCG '13
FacetAtlas, IBM, InfoVis '10.
SPIRE, PNL, InfoVis '95
Websites
Convention
word counts, the New York Times
Counting words
Word
clouds considered harmful, Jacob Harris
Wordle
EdWordle
Voyant Tools
State
of the Union Wordles, The Guardian
Concordance
software
State
of Union words, NY Times
SentenTree,
Georgia Tech & Twitter
TextArc, recreated
at vallandingham.me
Jigsaw, Georgia Tech
Dissertation
browser, Stanford
Text Vis Browser, Linnaeus Univ.
Nov. 6 -- Hierarchies and Trees 1 - Node-link
Relevant
S. Card and D. Nation, "Degree-of-Interest Trees: A Component
of an Attention-Reactive User Interface", Proc. of AVI '02, May 2002,
pp. 231-245.
J. Lamping and R. Rao, "The Hyperbolic Browser: A Focus +
Context Technique for Visualizing Large Hierarchies", Journal of
Visual Languages and Computing, Vol. 7, No. 1, pp. 33-55, March
1996.
C. Plaisant, et al, "SpaceTree:
Design Evolution of a Node Link Tree Browser", Proc. of InfoVis '02,
Oct. 2002, pp. 57-64.
G. Robertson, S. Card, and J. Mackinlay,
"Information Visualization Using 3D Interactive Animation",
Communications of the ACM, vol. 36, no. 4, Apr. 1993, pp. 57-71.
Videos
Information Visualizer, Xerox PARC
Hyperbolic Tree, Xerox PARC, CHI '96
3D Hyperbolic graphs, Stanford, T. Munzner
SpaceTree,
Univ. of Maryland, HCIL '02
Websites
Election
2016, from NY Times
Nov. 8 -- Hierarchies and Trees 2 - Space-filling
Relevant
B. Johnson and B. Shneiderman, "Tree-maps: A Space Filling
Approach to the Visualization of Hierarchical Information Structures",
Proc. of Vis '91, Oct. 1991, pp. 284-291.
B. Bederson, B. Shneiderman, and M. Wattenberg,
Ordered and Quantum Treemaps: Making Effective Use of 2D Space to
Display Hierarchies, ACM Trans. on Graphics, Vol. 21, No. 4,
Oct. 2002, pp. 833-854.
D.M. Bruls, C. Huizing and J.J. van Wijk,
"Squarified Treemaps", Proceedings of EuroGraphics 2000, pp. 33-42.
Q.V. Nguyen & M.L. Huang, "EncCon: an approach to constructing
interactive visualization of large hierarchical data",
Information Visualization, Vol. 4, No. 1, pp. 1-21.
J. Stasko and E. Zhang, "Focus+Context Display and Navigation
Techniques for Enhancing Radial, Space-Filling Hierarchy Visualizations",
Proc. of InfoVis '00, Oct. 2000, pp. 57-65.
W. Wang, H. Wang, G. Dai, H. Wang,
"Visualization of large hierarchical data by circle packing",
Proceedings of ACM CHI '06, April 2006, pp. 517-520.
Videos
Treemaps, Maryland, 1992
FundExplorer
from Georgia Tech
Sunburst
from Georgia Tech
Zoomology, InfoVis '03, Georgia Tech
Software
SequoiaView file
visualizer by Technische Universiteit Eindhoven
DaisyDisk, (SunBurst)
Websites
Map of the Market knockoff from finviz.com
Dynamic
layout algorithm
comparison applet created by Martin Wattenberg and Ben
Bederson
Treemaps,
Maryland HCIL
newsmap
Obama's
2012 budget proposal, (in treemap), from NY Times
2012
presidential election, Macrofocus
European
geography
Voronoi treemaps
from FoamTree
World
of Languages (voronoi treemap), visualcapitalist.com
Periodic
table SunBurst, Wijmo
Maze (SunBurst), Uber
World
food brands, Oxfam Intl.
treevis.net from Hans-Jorg Schulz
Nov. 13, 15 -- Graphs and Networks
Relevant
I. Herman, et al, "Graph Visualization and
Navigation in Information Visualization: A Survey", IEEE Trans.
on Visualization and Computer Graphics, Vol. 6, No. 1, Jan-Mar 2000,
pp. 24-43.
D. Holten, "Hierarchical edge bundles: Visualization of adjacency
relations in hierarchical data," IEEE Trans. on Visualization and
Computer Graphics, Vol. 12, No. 5, Sep.-Oct. 2006, pp. 741-748.
B. Lee, C. Parr, C. Plaisant, B. Bederson, V. Veksler, W. Gray,
and C. Kotfila
"TreePlus: Interactive Exploration of Networks with Enhanced Tree
Layouts", IEEE Trans. on Visualization and Computer Graphics,
Vol. 12, No. 6, Nov.-Dec. 2006, pp. 1414-1426.
B. Lee, C. Plaisant, C. Sims Parr, J.-D. Fekete, N. Henry, "Task
Taxonomy for Graph Visualization", Proc. of BELIV '06, April '06,
pp. 1-5.
A. Perer, B. Shneiderman, "Balancing Systematic and Flexible
Exploration of Social Networks,"
IEEE Trans. on Visualization and Computer Graphics, Vol. 12,
No. 5, Sep.-Oct. 2006, pp. 693-700.
B. Shneiderman, A. Aris, "Network Visualization by Semantic Substrates,"
IEEE Trans. on Visualization and Computer Graphics, Vol. 12,
No. 5, Sep.-Oct. 2006, pp. 733-740.
F. van Ham and A. Perer, "Search, Show Context, Expand on
Demand: Supporting Large Graph exploration with Degree-of-Interest",
IEEE Trans. on Visualization
and Computer Graphics, Vol. 15, No. 6, Nov.-Dec. 2009,
pp. 953-960.
M. Wattenberg, "Visual exploration of multivariate
graphs," Proceedings of ACM CHI '06, Montreal, Canada, April 2006,
pp. 811-819.
P.C. Wong, H. Foote, G. Chin, P. Mackey, K. Perrine, "Graph Signatures
for Visual Analytics",
IEEE Trans. on Visualization and Computer Graphics, Vol. 12,
No. 6, Nov.-Dec. 2006, pp. 1399-1413.
Videos
TreePlus,
Maryland
Semantic Substrates and SocialAction, Maryland, InfoVis '06
PivotSlice,
Toronto & UOIT
Social Action, Senator voting
patterns, Maryland
Vizster, UC Berkeley, InfoVis '05
Ploceus, Georgia
Tech, VAST '11
Graph-level
Operations (GLOs), Georgia Tech, InfoVis '14
Websites
Human
Diseases, New York Times
Live Plasma - music
artistis
Death
and Taxes, U.S. Budget
Social
Science visualization gallery
Social network analysis
Force-directed
example, Protovis, Stanford
Naming
names in presidential debates, NY Times
Circos, circular graph drawing
UUUNET North America
Where
People Run, from citylab.com
Transit Maps tumblr
London Tube
Actual
London subway geography
Walking lines for the Tube
Myths about H. Beck and the Tube map? , A. Cairo
Paris Metro map
Atlanta MARTA map
Game of Thrones transit map
GMap
- Graphs as Maps, Arizona
The
flavor connection, from Scientific American
Graph
drawing tutorial, Brown
Graph drawing resources, graphdrawing.org
Jung, Java Universal
Network/Graph Framework
Graph
drawing resources, AT&T Labs
cola.js,
from Monash Univ.
Gephi, Open Graph Viz Platform
TouchGraph
TouchGraph's Google browser
Visual Complexity -
Graph Visualizations
Semantic
substrates, Maryland
CiteVis,
Georgia Tech
Vizster, UC Berkeley
Social
Action, Maryland
MatrixExplorer &
NodeTrix, INRIA
Ploceus, Georgia Tech
Graph-level
Operations (GLOs), Georgia Tech
Planarity - graph layout game
Atlas of Cyberspace
Nov. 20 -- Evaluation
Relevant
S. Carpendale, "Evaluating Information Visualizations",
in Information Visualization: Human-Centered Issues and
Perspectives, (Editors: A. Kerren, J. Stasko, J.-D. Fekete,
C. North), Springer, 2008, pp. 19-45.
H. Lam, E. Bertini, P. Isenberg, C. Plaisant,
and S. Carpendale. "Empirical Studies in Information
Visualization: Seven Scenarios." IEEE Trans. on Visualization
and Computer Graphics, Vol. 18, No. 9, Sept. 2012, pp. 1520-1536.
A. Perer and B. Shneiderman, "Integrating statistics and
visualization: case studies of gaining clarity during exploratory data
analysis", Proc. of ACM CHI '08, April 2008,
pp. 265-274.
C. Plaisant, "The challenge of information visualization
evaluation", Proc. of AVI '04, May 2004, pp. 109-116.
G. Robertson, R. Fernandez, D. Fisher, B. Lee, and
J. Stasko, "Effectiveness of Animation in Trend Visualization,"
IEEE Trans. on Visualization and Computer Graphics, Vol. 14,
No. 6, Nov.-Dec. 2008, pp. 1325-1332.
B. Saket, A. Endert, and J. Stasko, "Beyond Usability
and Performance: A Review of User Experience-focused Evaluations in
Visualization", Proc. of BELIV 2016, Baltimore, MD, October 2016.
P. Saraiya et al, "An Insight-Based Methodology for Evaluating
Bioinformatics Visualizations", IEEE Trans. on Vis.
and Computer Graphics, Vol. 11, No. 4, Jul/Aug 2005, pp. 443-456.
B. Shneiderman, C. Plaisant,
"Strategies for evaluating information visualization tools:
multi-dimensional in-depth long-term case studies",
Proc. of BELIV '06, May 2006, pp. 1-7.
J. Stasko, R. Catrambone, M. Guzdial, K. McDonald, "An Evaluation
of Space-Filling Information
Visualizations for Depicting Hierarchical Structures",
International Journal of Human-Computer Studies, Vol. 53,
No. 5, Nov. 2000, pp. 663-694.
E. Wall, M. Agnihotri, L. Matzen, K. Divis,
M. Haass, A. Endert, and J. Stasko, "A Heuristic Approach
to Value-Driven Evaluation of Visualizations", IEEE Trans. on
Visualization and Computer Graphics, Vol. 25, No. 1, January 2019,
pp. 491-500.
Nov. 27 -- Visual Analytics
Relevant
D. Keim, G. Andrienko, J.-D. Fekete, C. Gorg, J. Kohlhammer, and
G. Melancon, "Visual Analytics: Definition, Process, and Challenges",
in Information Visualization: Human-Centered Issues and
Perspectives, (Editors: A. Kerren, J. Stasko, J.-D. Fekete,
C. North), Springer, 2008, pp. 1-18.
M. Bilgic, L. Licamele, L. Getoord, B. Shneiderman,
"D-Dupe: An Interactive Tool for Entity Resolution in Social Networks",
Proceedings of IEEE VAST '06, Oct. 2006, pp. 43-50.
R. Chang, et al, "Scalable and interactive visual analysis of
financial wire transactions for fraud detection", Information
Visualization, Vol. 7, No. 1, Spring 2008, pp. 63-76.
J. Stasko, C. Gorg, and Z. Liu, "Jigsaw: Supporting
Investigative Analysis through Interactive Visualization", Information
Visualization, Vol. 7, No. 2, Summer 2008, pp. 118-132.
C. Görg, et al, "Combining
Computational Analyses and Interactive Visualization for Document
Exploration and Sensemaking in Jigsaw", IEEE Trans.
on Visualization and Computer Graphics, Vol. 19, No. 10,
Oct. 2013, pp. 1646-1663.
J. Thomas and K. Cook, Illuminating the Path - The Research and
Development Agenda for Visual Analytics, IEEE Press, 2005.
P.C. Wong, et al, "Walking the path: a new journey to explore and
discover through visual analytics", Information Visualization,
Vol. 5, No. 4, Winter 2006, pp. 237-249.
W. Wright, D. Schroh, P. Proulx, A. Skaburskis, and
B. Cort, "The sandbox for analysis: concepts and
evaluation", Proceedings of ACM CHI '06, April 2006,
pp. 801-810.
Websites
Visual Analytics
Community
Visual Analytics in the
EU
InterAxis,
Georgia Tech
LineUp, Caleydo
Jigsaw,
Georgia Tech
Videos
Visual
Analytics, VisMaster
Precision Information
Environments vision video
Jigsaw
(academic papers),
Georgia Tech, TVCG '13
Jigsaw
(car reviews),
Georgia Tech, TVCG '13
Sandbox,
Oculus/Uncharted, VAST '07 Contest
Entity Workspace, PARC
Analyst's Workspace, Va Tech, VAST '12
IN-SPIRE, PNNL
D-Dupe, Maryland, VAST '06
WireVis, UNCC, Information Visualization '08
Coast
Guard Search & Rescue, Overview,
Scenario,
Purdue, VAST '11
Dec. 4 -- Casual InfoVis
Relevant
Z. Pousman, J. T. Stasko and M. Mateas, "Casual
Information Visualization: Depictions of Data in Everyday Life",
IEEE Transactions on Visualization and Computer Graphics,
Vol. 13, No. 6, November/December 2007, pp. 1145-1152.
Additional Papers
T. Skog, et al, "Between Aesthetics and
Utility: Designing Ambient Information Visualizations", Proc.
of InfoVis '03, pp. 233-240.
J. Fogarty, et al., "Aesthetic information collages: generating
decorative displays that contain information," Proc. UIST '01,
Nov. 2001, pp. 141-150.
J. Stasko, et al, "Personalized Peripheral Information Awareness
through Information Art", Proc. of UbiComp '04, Sept. 2004, pp. 18-35.
M. van Dantzich, et al., "Scope: Providing awareness of multiple
notifications at a glance," Proc. AVI '02, May 2002, pp. 267-281.
F. Viegas and M. Wattenberg, "Artistic data visualization:
Beyond visual analytics," Proceedings of HCII 2007, July 2007, pp. 182-191.
Websites
InfoVis
& Art, Presentation by Viegas & Wattenberg at InfoVis '06
Jason Salavon's art
Feltron
Annual Report, One's life as an annual report
Ambient Devices
Informative Art,
Viktoria Institute
InfoCanvas,
Georgia Tech
We Feel Fine -
Visualizing feelings
Videos
ambientROOM, MIT, CHI '98
InfoCanvas,
InfoVis '05
Dropped -- Commercial Systems Demos & Discussion
Class Slides
PDF
Relevant
M. Spenke and C. Beilken, "InfoZoom - Analysing Formula One
racing results with an interactive data mining and visualization
tool," Proceedings of 2nd Intl. Conf. on Data Mining,
July 2000.
Additional Papers
S. Eick, "Visual Discovery and Analysis", IEEE Transactions on
Visualization and Computer Graphics, Vol. 6, No. 1, Jan-Mar 2000,
pp. 44-58.
Software
Spotfire from TIBCO
Tableau from Tableau Software
Qlik Sense from Qlik
InfoZoom from HumanIT
Nov. 30 -- Review
Class Slides
PDF
Relevant
J. Heer, M. Bostock, and V. Ogievetsky, "A Tour through the
Visualization Zoo", Communications of the ACM, Vol. 53, No. 6,
June 2010, pp. 59-67.
Additional Papers
dropped -- Social Visualization
Class Slides
PDF
Relevant
F. Viegas, S. Golder, and J. Donath,
"Visualizing Email Content: Portraying Relationships from
Conversational Histories", Proceedings of CHI 2006, Montreal, Canada,
April 2006, pp. 979-988.
M. Wattenberg and J. Kriss, "Designing for Social Data
Analysis," IEEE Transactions on Visualization and Computer
Graphics Vol. 12, No. 4, Jul.-Aug. 2006, pp. 549-557.
Additional Papers
D. Baur, F. Seiffert, M. Sedlmair, and S. Boring,
"The Streams of Our Lives: Visualizing Listening Histories in Context",
IEEE Transactions on Visualization and Computer Graphics,
(InfoVis '10), Vol. 16, No. 6, Nov/Dec 2010, pp. 1119-1128.
J. Donath, K. Karahalios, and F. Viegas,
"Visualizing Conversations", Proc. of HICSS-32, Jan. 1999.
M. Dork, D. Gruen, C. Williamson, and S.
Carpendale, "A Visual Backchannel for Large-Scale Events",
IEEE Transactions on Visualization and Computer Graphics,
(InfoVis '10), Vol. 16, No. 6, Nov/Dec 2010, pp. 1129-1138.
J. Heer and d. boyd, "Vizster: Visualizing Online Social
Networks", Proc. of IEEE InfoVis '05, Oct. 2005, pp. 33-40.
F. Viegas, d. boyd, D. Nguyen, J. Potter, J. Donath, "Digital
Artifacts for Remembering and Storytelling: PostHistory and Social
Network Fragments," Proc. of HICSS'04, Jan. 2004.
F. Viegas, E. Perry, E. Howe, and J. Donath,
"Artifacts of the Presence Era: Using Information Visualization to
Create an Evocative Souvenir," Proc. of IEEE InfoVis '04,
Oct. 2004, pp. 105-111.
R. Xiong and J. Donath, "People Garden: Creating Data
Portraits for Users," Proc. of UIST '99, Nov. 1999, pp. 37-44.
Websites
Social
Visualization Workshop, from CHI '06
Social Media Group, MIT
Social Spaces Group, Illinois
NameVoyager
of the Baby Name Wizard
Videos
Visual Backchannel, Univ. Calgary, InfoVis '10
LastHistory,
InfoVis '10
dropped -- Animation
Class Slides
PDF
Relevant
J. Heer and G. Robertson. "Animated Transitions in
Statistical Data Graphics," IEEE Transactions on Visualization and
Computer Graphics Vol. 13, No. 6, Nov.-Dec. 2007, pp. 1240-1247.
Additional Papers
L. Bartram, et al, "Moticons: detection,
distraction, and task", Intl. Journal of Human-Computer
Studies, Vol. 58, No. 5, May 2003, pp. 515-545.
G.G. Robertson, S.K. Card, and J.D. Mackinlay,
"Information Visualization Using 3D Interactive Animation",
Communications of the ACM, Vol. 36, No. 4, Apr. 1993,
pp. 57-71.
G. Robertson, R. Fernandez, D. Fisher, B. Lee, and
J. Stasko, "Effectiveness of Animation in Trend Visualization,"
IEEE Trans. on Visualization and Computer Graphics, Vol. 14,
No. 6, Nov.-Dec. 2008, pp. 1325-1332.
Websites
Animated
transitions in visualizations, J. Heer, Stanford
Videos
Rosling's updated GapMinder talk - from BBC, 2010
|