This New Tool Can Track the Environmental Cost of Your Machine Learning Model
Energy consumption is a major factor to plan for when implementing a long-term project or service that uses large-scale machine learning algorithms.
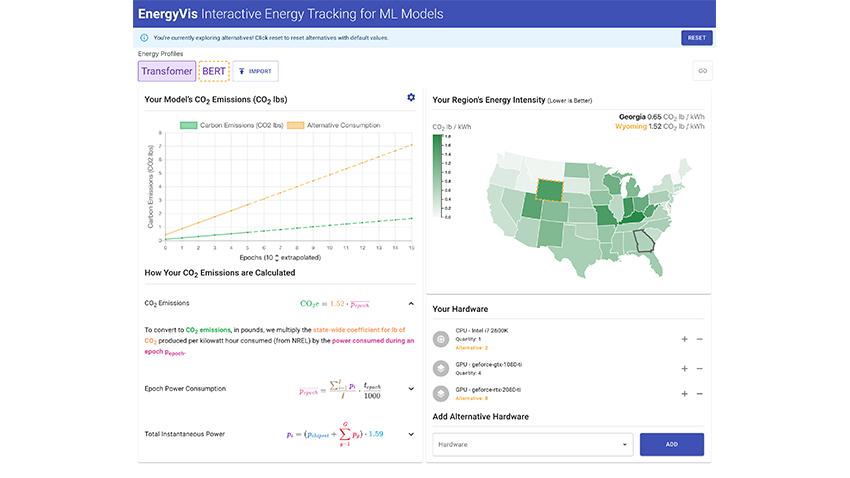
Now, a team of researchers from Georgia Tech has created an interactive tool called EnergyVis that allows users to compare energy consumption across locations and against other models.
EnergyVis helps users answer three critical questions:
- What is the environmental cost to train or run this algorithm?
- How does this algorithm compare to others in terms of cost?
- Can a team in a different location run this algorithm for the same cost?
“Sometimes, training machine learning models from end-to-end takes the same amount of energy as a transatlantic flight. Is every organization using machine learning able to budget for such an expense? What if the grid in which a business runs is running on coal versus green energy?” said Omar Shaikh, a computer science undergraduate student.
Shaikh is helping lead the research for this interactive dashboard along with M.S. student Jon Saad-Falcon, Ph.D students Austin P. Wright, Nilaksh Das, Scott Freitas, and faculty advisors School of Public Policy Assistant Professor Omar Asensio and School of Computational Science and Engineering (CSE) Associate Professor Polo Chau.
According to Shaikh, prior research that aims to track energy consumption is already available. However, EnergyVis distinguishes itself by offering a more visually appealing dashboard and easier user experience to enable energy tracking and energy usage comparisons across models and across scenarios.
“A common counterargument for why we should track model energy consumption is that models don’t use as much energy as many other things comparatively – so, what’s the point?” he said. “The point of EnergyVis is that it not only tracks their energy usage, but it also keeps people accountable for how much energy they are using.”
Another utility of the new dashboard is that it allows for better reproducibility for researchers working in different locations. With the ability to budget and better determine energy usage, teams are better able to plan where a deployment may or may not be cost effective or environmentally friendly.
“If you’re training your model in a state that largely uses coal-burning energy sources, your CO2 output for the electricity your model is using is going to be much higher than if you were to train or use your model in an area using green energy,” said Shaikh.
While this new visualization tool is in its initial phases, Shaikh says that the research team would like to consider plans to expand and generalize EnergyVis for any computing-intensive task.