Former Student Earns Top Award at Premier Visualization Conference
A former Georgia Tech Ph.D. student received the 2021 Visualization Dissertation Award and three pieces of research were recognized for best poster and best poster honorable mention at IEEE VIS 2021.
The conference, being held virtually Oct. 24-29, is attended annually by researchers in the field from around the globe applying insights in theory, methods, and applications of visualizations and visual analytics. It is the premier forum for research in its field.
Arjun Srinivasan, who was advised by Regents’ Professor John Stasko before graduating with a Ph.D. in computer science from Georgia Tech in 2020, was recognized for his work titled Combining Natural Language and Direct Manipulation for Human-Data Interaction Through Visualizations.
The research seeks to reimagine interaction techniques with data visualization tools, expanding beyond the traditional keyboard and mouse interface to take advantage of naturalistic human interaction like touch or speech. It further evaluates the multimodal interaction design for strengths and challenges and highlights how each accommodates varying patterns of user interaction.
The award recognizes the top Ph.D. dissertation in the field of data visualization from the previous year.
In addition to Srinivasan’s work, three posters were also recognized by the conference.
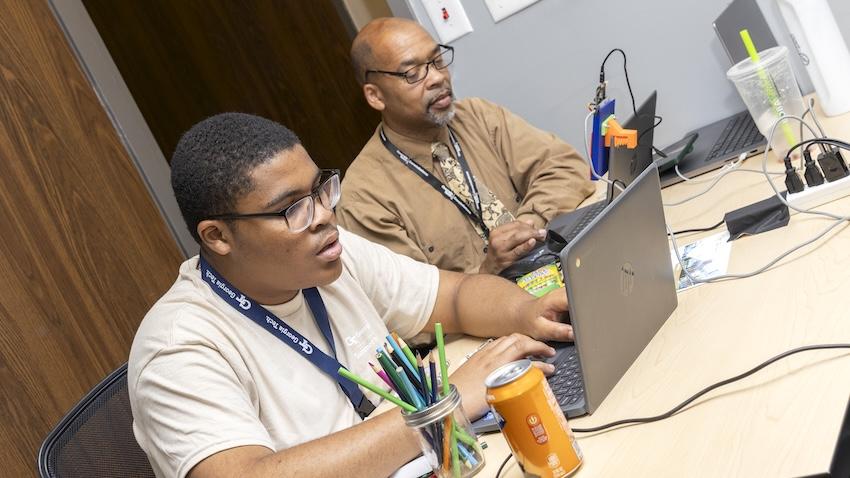
One, titled Towards Automatic Grading of D3.js Visualizations, earned VIS Best Poster. Its authors – Matthew Hull, Connor Guerin, Justin Chen, Susanta Routray, and Duen Horng (Polo) Chau – are all Georgia Tech affiliated.
Two others were named best paper honorable mentions:
- Argo Scholar: Interactive Visual Exploration of Literature in Browsers (Kevin Li, Haoyang (Alex) Yang, Anish Upadhayay, Zhiyan (Frank) Zhou, Jon Saad-Falcon, Duen Horng (Polo) Chau).
- TrafficVis: Fighting Human Trafficking Through Visualization (Catalina Vajiac, Andreas Olligschlaeger, Yifei Li, Pratheeksha Nair, Meng-Chieh Lee, Namyong Park, Reihaneh Rabbany, Duen Horng (Polo) Chau, Christos Faloutsos).
Overall, Georgia Tech was represented with 12 papers, posters, talks, and panels at IEEE VIS. Explore each through the titles, abstracts, and links below, and follow @ICatGT on Twitter for more coverage of the conference.
Lumos: Increasing Awareness of Analytic Behavior during Visual Data Analysis
Arpit Narechania, Adam Coscia, Emily Wall (Emory University), Alex Endert
Visual data analysis tools provide people with the agency and flexibility to explore data using a variety of interactive functionalities. However, this flexibility may introduce potential consequences in situations where users unknowingly overemphasize or underemphasize specific subsets of the data or attribute space they are analyzing. For example, users may overemphasize specific attributes and/or their values (e.g., Gender is always encoded on the X axis), underemphasize others (e.g., Religion is never encoded), ignore a subset of the data (e.g., older people are filtered out), etc. In response, we present Lumos, a visual data analysis tool that captures and shows the interaction history with data to increase awareness of such analytic behaviors. Using in-situ (at the place of interaction) and ex-situ (in an external view) visualization techniques, Lumos provides real-time feedback to users for them to reflect on their activities. For example, Lumos highlights datapoints that have been previously examined in the same visualization (in-situ) and also overlays them on the underlying data distribution (i.e., baseline distribution) in a separate visualization (ex-situ). Through a user study with 24 participants, we investigate how Lumos helps users' data exploration and decision-making processes. We found that Lumos increases users' awareness of visual data analysis practices in real-time, promoting reflection upon and acknowledgement of their intentions and potentially influencing subsequent interactions.
Left, Right, and Gender: Exploring Interaction Traces to Mitigate Human Biases
Emily Wall (Emory University), Arpit Narechania, Adam Coscia, Jamal Paden, Alex Endert
Human biases impact the way people analyze data and make decisions. Recent work has shown that some visualization designs can better support cognitive processes and mitigate cognitive biases (i.e., errors that occur due to the use of mental "shortcuts"). In this work, we explore how visualizing a user's interaction history (i.e., which data points and attributes a user has interacted with) can be used to mitigate potential biases that drive decision making by promoting conscious reflection of one's analysis process. Given an interactive scatterplot-based visualization tool, we showed interaction history in real-time while exploring data (by coloring points in the scatterplot that the user has interacted with), and in a summative format after a decision has been made (by comparing the distribution of user interactions to the underlying distribution of the data). We conducted a series of in-lab experiments and a crowd-sourced experiment to evaluate the effectiveness of interaction history interventions toward mitigating bias. We contextualized this work in a political scenario in which participants were instructed to choose a committee of 10 fictitious politicians to review a recent bill passed in the U.S. state of Georgia banning abortion after 6 weeks, where things like gender bias or political party bias may drive one's analysis process. We demonstrate the generalizability of this approach by evaluating a second decision making scenario related to movies. Our results are inconclusive for the effectiveness of interaction history (henceforth referred to as interaction traces) toward mitigating biased decision making. However, we find some mixed support that interaction traces, particularly in a summative format, can increase awareness of potential unconscious biases.
Arpit Narechania, Alireza Karduni (UNC Charlotte), Ryan Wesslen (UNC Charlotte), Emily Wall (Northwestern University)
There are a few prominent practices for conducting reviews of academic literature, including searching for specific keywords on Google Scholar or checking citations from some initial seed paper(s). These approaches serve a critical purpose for academic literature reviews, yet there remain challenges in identifying relevant literature when similar work may utilize different terminology (e.g., mixed-initiative visual analytics papers may not use the same terminology as papers on model-steering, yet the two topics are relevant to one another). In this paper, we introduce a system, VitaLITy, intended to complement existing practices. In particular, VitaLITy promotes serendipitous discovery of relevant literature using transformer language models, allowing users to find semantically similar papers in a word embedding space given (1) a list of input paper(s) or (2) a working abstract. VitaLITy visualizes this document-level embedding space in an interactive 2-D scatterplot using dimension reduction. VitaLITy also summarizes meta information about the document corpus or search query, including keywords and co-authors, and allows users to save and export papers for use in a literature review. We present qualitative findings from an evaluation of VitaLITy, suggesting it can be a promising complementary technique for conducting academic literature reviews. Furthermore, we contribute data from 38 popular data visualization publication venues in VitaLITy, and we provide scrapers for the open-source community to continue to grow the list of supported venues.
What is the Role of VIS in Combating COVID-19?
Min Chen (University of Oxford), David Ebert (University of Oklahoma), Lace Padilla (UC Merced), Yixuan Zhang (Georgia Tech), Alfie Abdul-Rahman (Organizer, King's College London)
Visualization and visual analytics (VIS) plays an important role in combating COVID-19. We can clearly observe this fact in the charts and graphs for public consumption in the media, and can also identify various visual analytics techniques that have been developed for domain experts in their analysis and modeling of COVID-19 data. In this panel, we ask four researchers - "What is the Role of VIS in Combating COVID-19?". Our panelists will cover a number of topics including developing VIS techniques and systems, conducting empirical studies, and deploying VIS for public health surveillance and intervention planning. The panelists will discuss a range of questions, reflecting on the recent and ongoing work by VIS colleagues and examining challenges in deploying a wide range of VIS techniques in emergency responses.
In this panel, we ask four panelists to reflect on the question "What is the Role of VIS in Combating COVID-19?" based on their observation and experience. Our objectives are:
- to reflect on the recent and ongoing work by VIS colleagues in supporting different efforts for combating COVID-19;
- to demonstrate the broad and important role of VIS in emergency responses;
- to examine challenges in deploying a wide range of VIS techniques in emergency responses; and
- to stimulate new research programs for addressing such challenges.
A Critical Reflection on Visualization Research:Where Do Decision Making Tasks Hide?
Evanthia Dimara (Utrecht University) and John Stasko
It has been widely suggested that a key goal of visualization systems is to assist decision making, but is this true? We conduct a critical investigation on whether the activity of decision making is indeed central to the visualization domain. By approaching decision making as a user task, we explore the degree to which decision tasks are evident in visualization research and user studies. Our analysis suggests that decision tasks are not commonly found in current visualization task taxonomies and that the visualization field has yet to leverage guidance from decision theory domains on how to study such tasks. We further found that the majority of visualizations addressing decision making were not evaluated based on their ability to assist decision tasks. Finally, to help expand the impact of visual analytics in organizational as well as casual decision making activities, we initiate a research agenda on how decision making assistance could be elevated throughout visualization research.
VAINE: Visualization and AI for Natural Experiments
Grace Guo, Maria Glenski (PNNL), Zhuanyi Huang (Amazon), Emily Saldanha (PNNL), Alex Endert, Svitlana Volkova (PNNL), Dustin L Arendt (PNNL)
Natural experiments are observational studies where the assignment of treatment conditions to different populations occurs by chance "in the wild". Researchers from fields such as economics, healthcare, and the social sciences leverage natural experiments to conduct hypothesis testing and causal effect estimation for treatment and outcome variables that would otherwise be costly, infeasible, or unethical. In this paper, we introduce VAINE (Visualization and AI for Natural Experiments), a visual analytics tool for identifying and understanding natural experiments from observational data. We then demonstrate how VAINE can be used to validate causal relationships, estimate average treatment effects, and identify statistical phenomena such as Simpson's paradox through two usage scenarios.
Understanding the Effects of Visualizing Missing Values on Visual Data Exploration
Hayeong Song, Yu Fu, Bahador Saket, John Stasko
When performing data analysis, people often confront data sets containing missing values. We conducted an empirical study to understand the effects of visualizing those missing values on participants' decision-making processes while performing a visual data exploration task. More specifically, our study participants purchased a hypothetical portfolio of stocks based on a dataset where some stocks had missing values for attributes such as PE ratio, beta, and EPS. The experiment used scatterplots to communicate the stock data. For one group of participants, stocks with missing values simply were not shown, while the second group saw such stocks depicted with estimated values as points with error bars. We measured participants' cognitive load involved in decision-making with data with missing values. Our results indicate that their decision-making workflow was different across two conditions.
NeuroCartography: Scalable Automatic Visual Summarization of Concepts in Deep Neural Networks
Haekyu Park, Nilaksh Das, Rahul Duggal, Austin P. Wright, Omar Shaikh, Fred Hohman, Polo Chau
Existing research on making sense of deep neural networks often focuses on neuron-level interpretation, which may not adequately capture the bigger picture of how concepts are collectively encoded by multiple neurons. We present NeuroCartography, an interactive system that scalably summarizes and visualizes concepts learned by neural networks. It automatically discovers and groups neurons that detect the same concepts, and describes how such neuron groups interact to form higher-level concepts and the subsequent predictions. NeuroCartography introduces two scalable summarization techniques: (1) neuron clustering groups neurons based on the semantic similarity of the concepts detected by neurons (e.g., neurons detecting "dog faces" of different breeds are grouped); and (2) neuron embedding encodes the associations between related concepts based on how often they co-occur (e.g., neurons detecting "dog face" and "dog tail" are placed closer in the embedding space). Key to our scalable techniques is the ability to efficiently compute all neuron pairs' relationships, in time linear to the number of neurons instead of quadratic time. NeuroCartography scales to large data, such as the ImageNet dataset with 1.2M images. The system's tightly coordinated views integrate the scalable techniques to visualize the concepts and their relationships, projecting the concept associations to a 2D space in Neuron Projection View, and summarizing neuron clusters and their relationships in Graph View. Through a large-scale human evaluation, we demonstrate that our technique discovers neuron groups that represent coherent, human-meaningful concepts. And through usage scenarios, we describe how our approaches enable interesting and surprising discoveries, such as concept cascades of related and isolated concepts. The NeuroCartography visualization runs in modern browsers and is open-sourced.
Towards Automatic Grading of D3.js Visualizations
Matthew Hull, Connor Guerin, Justin Lu Chen, Susanta Kumar Routray, Polo Chau
Manually grading D3 data visualizations is a challenging endeavor, and is especially difficult for large classes with hundreds of students. Grading an interactive visualization requires a combination of interactive, quantitative, and qualitative evaluation that are conventionally done manually and are difficult to scale up as the visualization complexity, data size, and number of students increase. We present a first-of-its kind automatic grading method for D3 visualizations that scalably and precisely evaluates the data bindings, visual encodings, interactions, and design specifications used in a visualization. Our method has shown potential to enhance students’ learning experience, enabling them to submit their code frequently and receive rapid feedback to better inform iteration and improvement to their code and visualization design. Our method promotes consistent grading and enables instructors to dedicate more focus to assist students in gaining visualization knowledge and experience. We have successfully deployed our method and auto-graded D3 submissions from more than 1000 undergraduate and graduate students in Georgia Tech’s CSE6242 Data and Visual Analytics course, and received positive feedback and encouragement for expanding its adoption
Argo Scholar: Interactive Visual Exploration of Literature in Browsers
Kevin Li, Haoyang Yang, Anish Upadhayay, Zhiyan Zhou, Jon Saad-Falcon, Polo Chau
Discovering and making sense of relevant research literature is fundamental to becoming knowledgeable in any scientific discipline. Visualization can aid this process; however, existing tools’ adoption and impact have often been constrained, such as by their reliance on small curated paper datasets that quickly become outdated or a lack of support for personalized exploration. We introduce ARGO SCHOLAR, an open-source, web-based visualization tool for interactive exploration of literature and easy sharing of exploration results. ARGO SCHOLAR queries and visualizes Semantic Scholar’s live data of almost 200 million papers, enabling users to generate personalized literature exploration results in real-time through flexible, incremental exploration, a common and effective method for researchers to discover relevant work. Our tool allows users to easily share their literature exploration results as a URL or web-embedded IFrame application.
TrafficVis: Visualizing Suspicious Meta-Clusters for Human Trafficking Detection
Catalina Vajiac, Andreas Olligschlaeger, Yifei Li, Pratheeksha Nair, Meng-Chieh Lee, Namyong Park, Reihaneh Rabbany, Polo Chau, Christos Faloutsos