Why is This New Deep Learning Visualization Going Viral?
Interactive visualizations are quickly becoming a favorite tool to help teach and learn deep learning subjects. One visualization in particular is rising to the top of GitHub, Twitter, and LinkedIn as a standout resource to understand convolutional neural networks (CNNs).
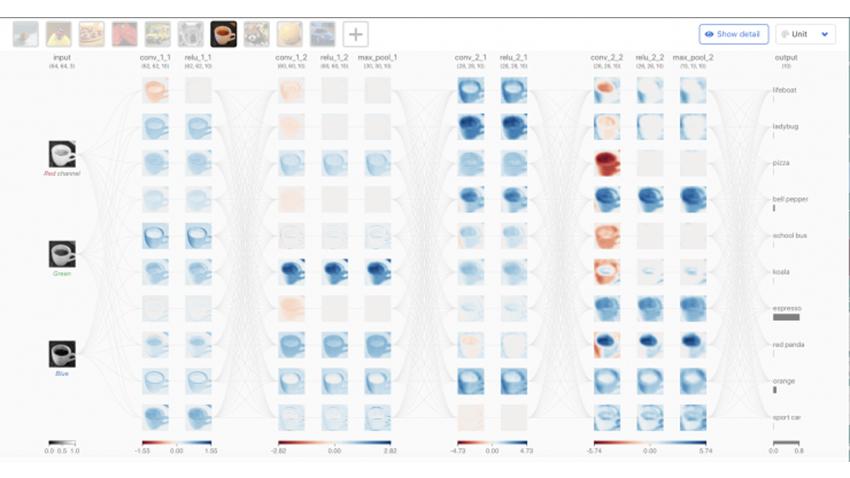
Created by Georgia Tech and Oregon State University researchers over the course of a year, CNN Explainer is a robust interactive visualization tool uniquely developed for deep learning beginners.
By combining visualizations, animation, and transitions, CNN Explainer enables users to inspect the interplay between low-level mathematical operations and high-level model structures. Presenting views with different level of details gives users control over what technique they focus on and allows them to transition to others when they are ready.
“While there are other existing tools that help explain CNNs for beginners, this tool is quite different in how comprehensive its depth is and how it combines everything together,” said Zijie Jay Wang, the primary investigator of this work.
“Some tools only explain high level structures while others only focus on low level mathematical instruction. We wanted to build a tool that could integrate everything together and use transitions to help users navigate through different structures and their levels of detail,” he said.
While CNN Explainer was originally created with students and deep learning instructors in mind, general professionals and avid deep learning professionals are also showing excitement and interest in this new tool.
“Many professionals who want to find out more about deep learning, and machine learning are accessing and using CNN Explainer, and it is helping them get started in this field. Meanwhile, avid deep learning practitioners have been adapting CNN Explainer to debug their own models,” said Wang.
The traction CNN Explainer has gained across web communities is another undeniable testament to its usability and need. Since its public release on May 1st, it has received almost 5000 GitHub stars and an average of 300 daily visitors from more than 80 countries.
“The success of CNN Explainer has really shown me how the power of visualization can help people interact with their machine learning models,” continued Wang. “It is a very good interface for both beginners and experts, and in the future, I will try to design more tools for all levels to help them interpret, debug, and understand their models.”
Currently, CNN Explainer has also become a popular tool in deep learning courses—used by instructors from Georgia Tech, University of Wisconsin–Madison, University of Tokyo, and more.
School of Interactive Computing Associate Professor and Facebook AI Research Scientist Dhruv Batra is an early adopter of this tool and currently uses the tool in his Intro to Perception and Robotics course at Georgia Tech.
According to Batra, “I have used CNN Explainer and other visualization tools created by the Polo Club of Data Science in my class. I find such visualizations to be highly valuable in explaining ostensibly complicated concepts in a simple visual way.”
“I am visual learner myself; if I can picture things like the flow of spatial feature maps in a CNN, I can understand the concepts easily. And plenty of research in pedagogy suggests that I am not atypical. In CS 4803/7643 Deep Learning, I augment formal mathematical description with such visualizations, and I am highly appreciative of tools like the CNN Explainer,” said Batra.
The paper outlining CNN Explainer’s process and programming will be presented at the top visualization conference, IEEE VIS 2020. It is also among the selected VIS papers published at IEEE Transactions on Visualization and Computer Graphics, the top visualization journal.